Figure 3.

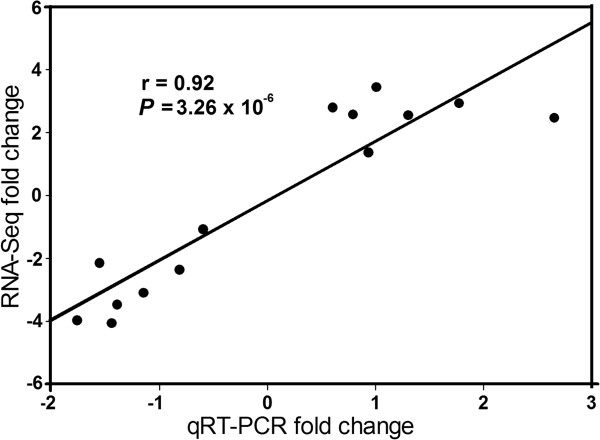
qRT-PCR validation of RNA-Seq results. Validation of gene expression (14 genes) using Pearson’s correlation (r) between fold changes (log2 scale) observed in qRT-PCR and RNA-Seq results.

qRT-PCR validation of RNA-Seq results. Validation of gene expression (14 genes) using Pearson’s correlation (r) between fold changes (log2 scale) observed in qRT-PCR and RNA-Seq results.