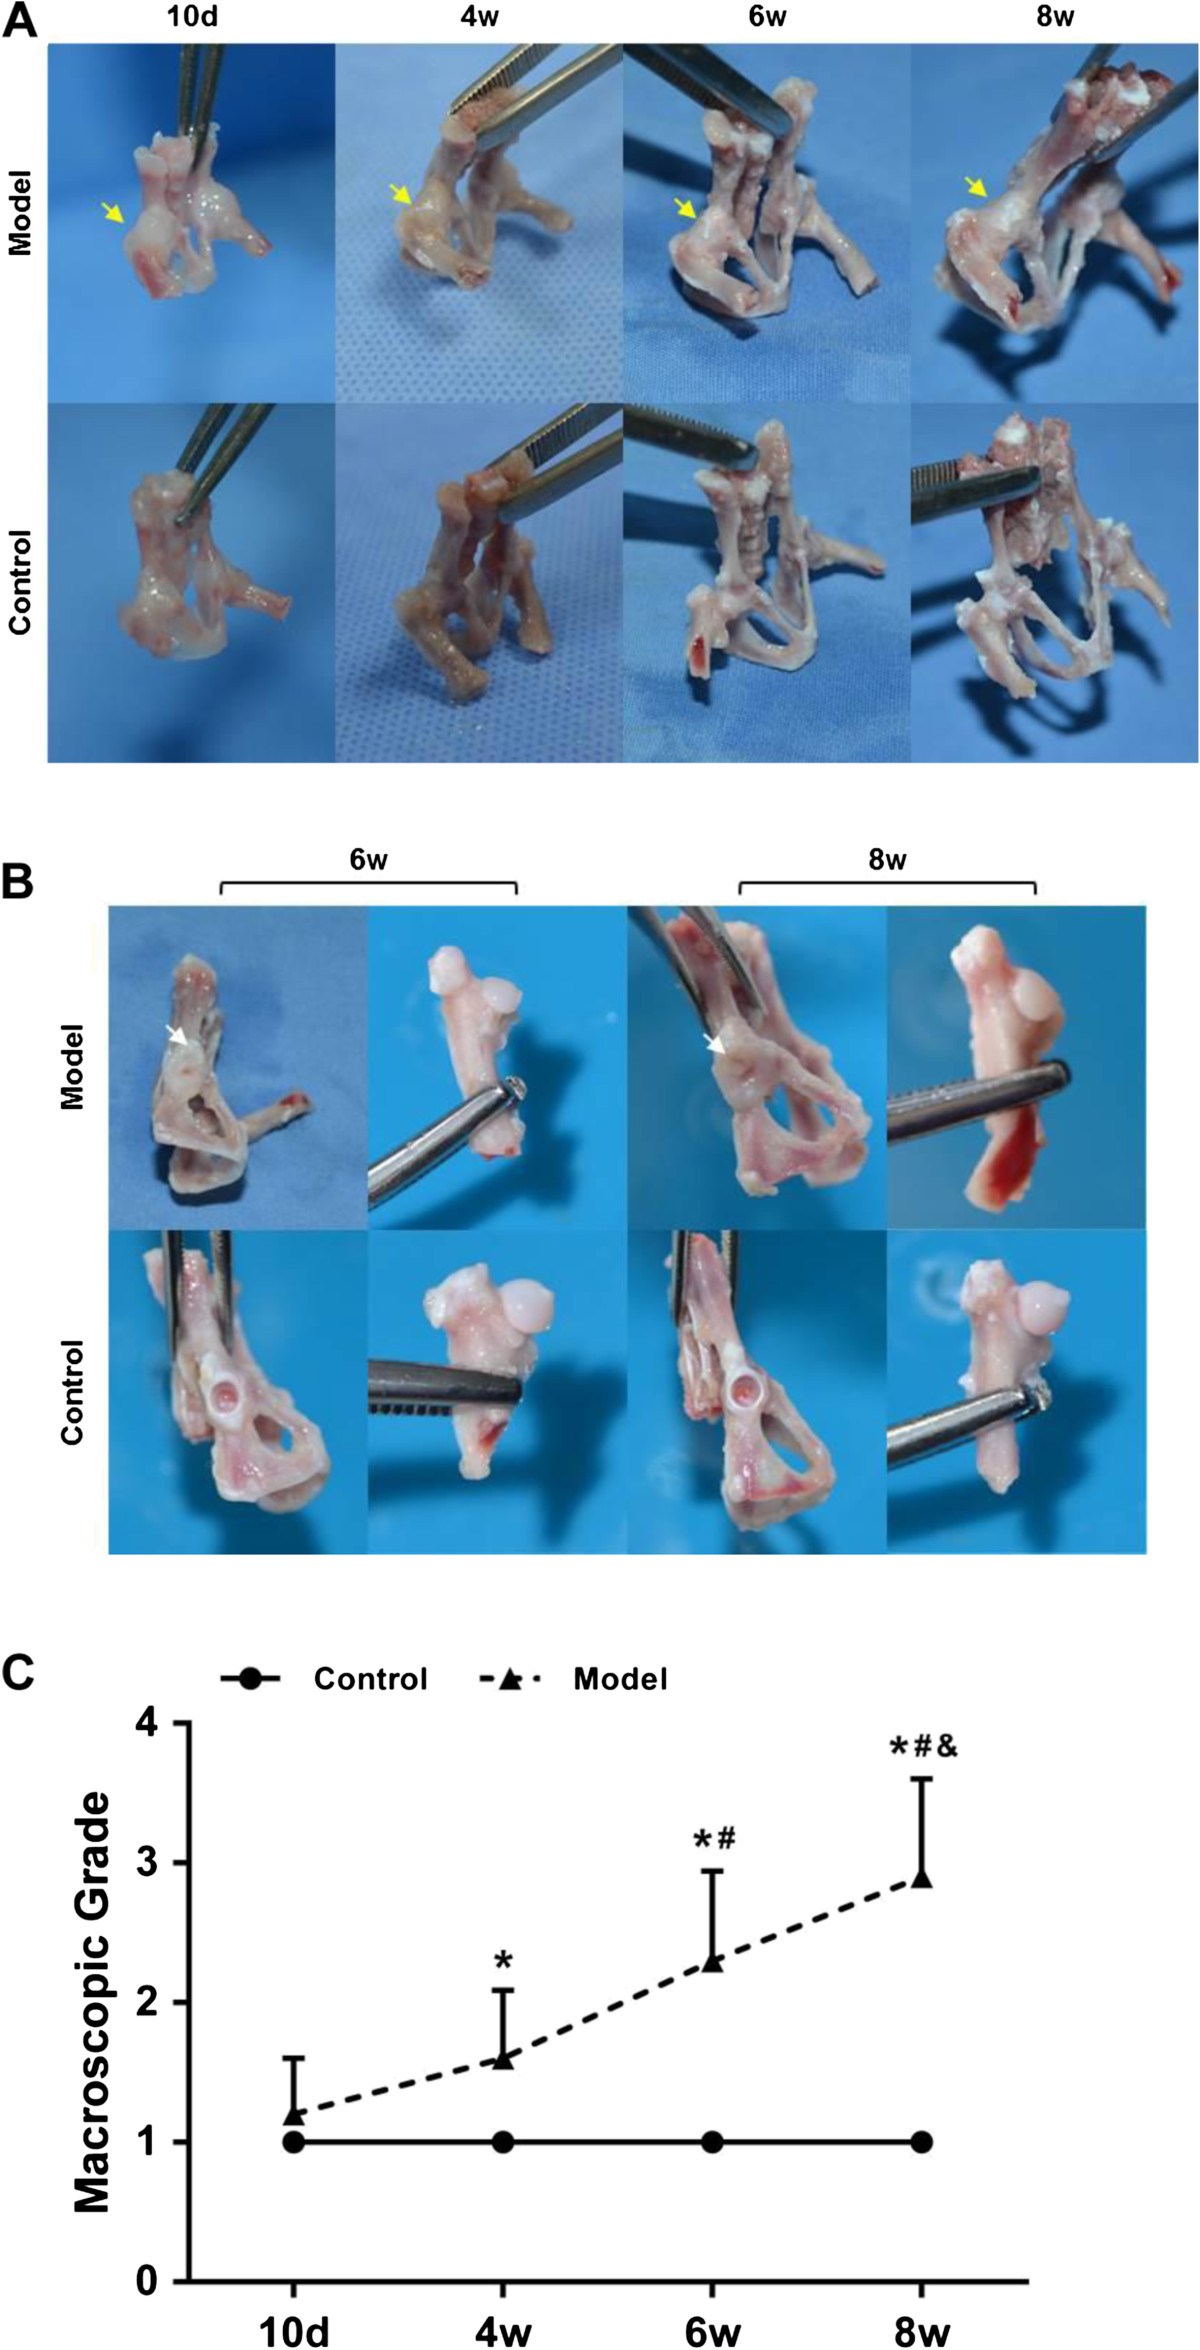
Figure 1.

Time course changes of the macroscopic features of the hips. (A) General view of the hips in each group at different time points (yellow arrows indicating the thickening of the joint capsule). (B) Local appearances of the acetabulum and the femoral head in each group at the end of post-natal week 6 and week 8 (white arrows indicating the false acetabulum). (C) Macroscopic grade of the femoral head cartilage in each group at different time points. Note: *: P <0.05 vs mice in control group; #: P <0.05 vs mice at post-natal day 10; &: P <0.05 vs mice at post-natal week 4.
