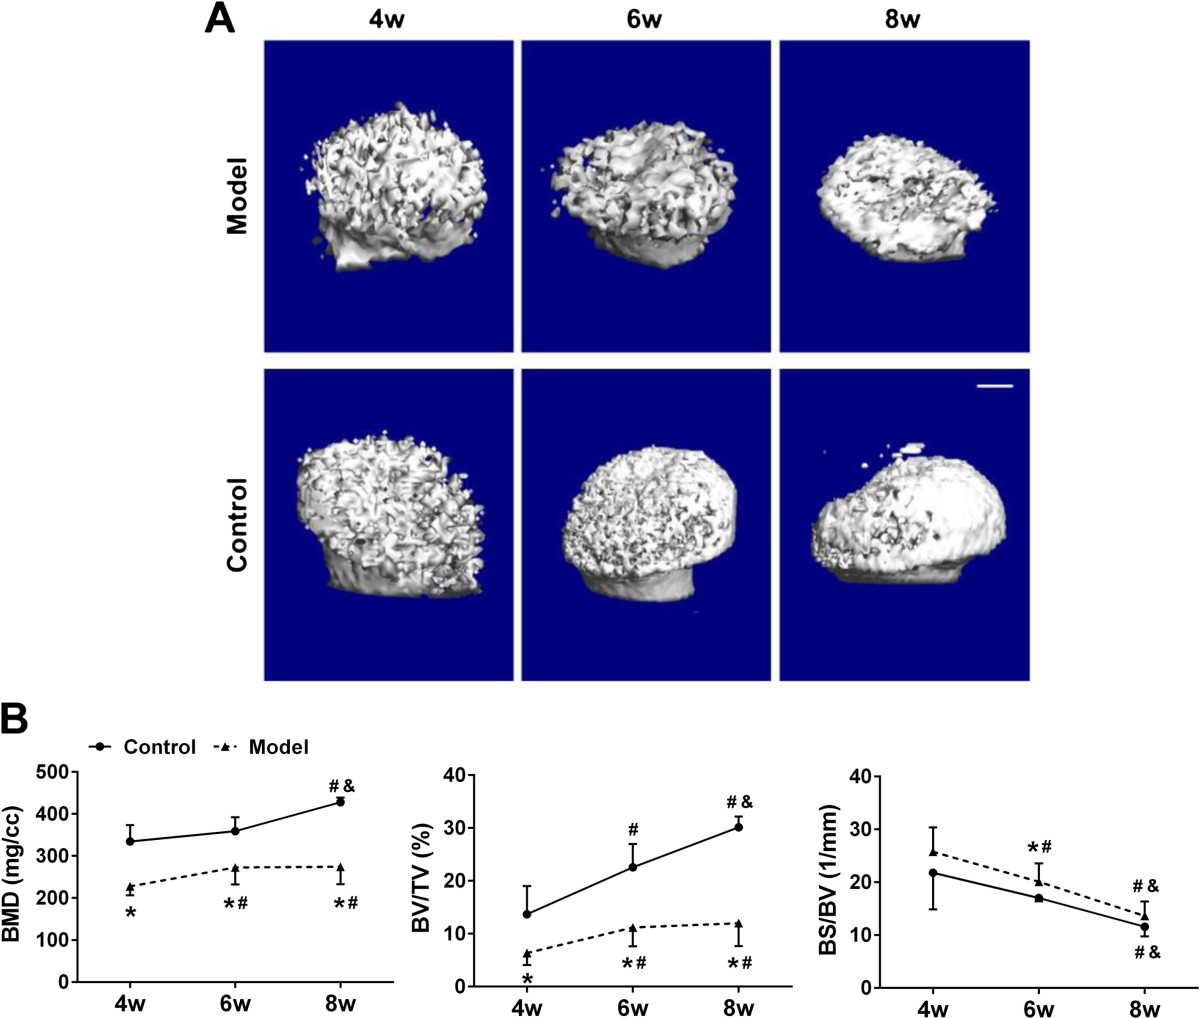
Figure 4.

Time course changes of the bony structure of the femoral head and neck region by three-dimensional μCT analysis. (A) Representative three-dimensional μCT reconstructed images of the femoral head and neck region in each group at post-natal week 4, 6 and 8. (B) Quantitative analysis of the bony structure of the femoral head and neck region in each group at post-natal week 4, 6 and 8. Note: *: P <0.05 vs mice in control group; #: P <0.05 vs mice at post-natal week 4; &: P <0.05 vs mice at post-natal week 6.
