Figure 5.

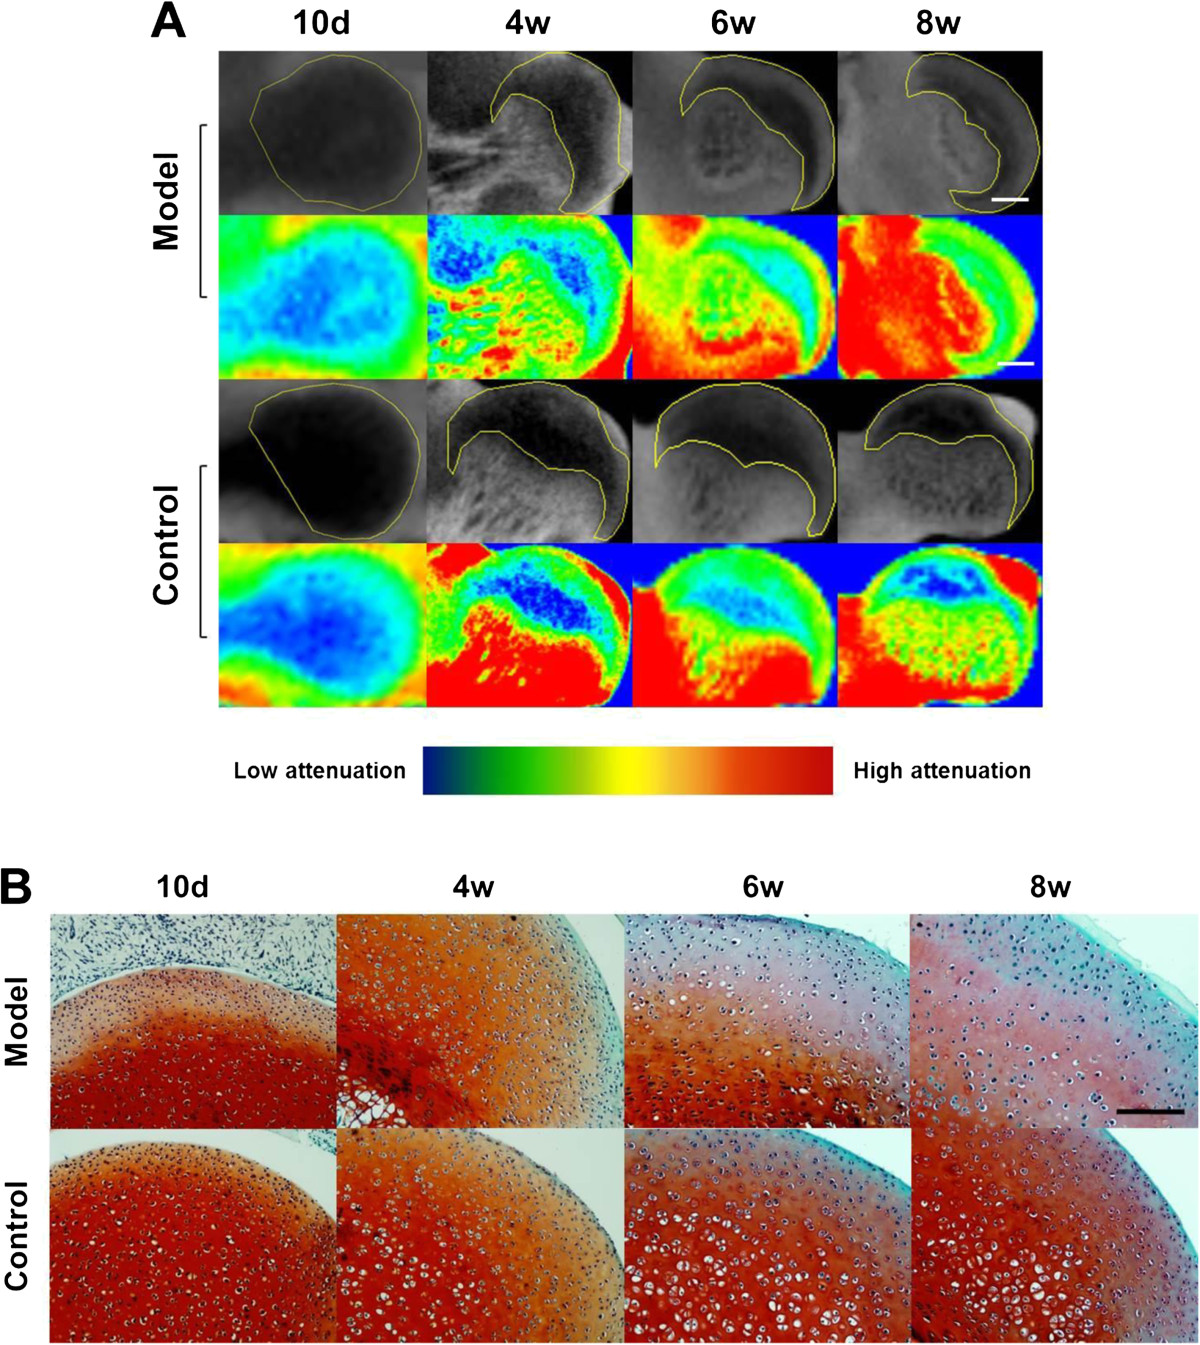
Representative CE-μCT images (A) and corresponding histological sections (B) of the femoral head cartilage in each group at different time points.

Representative CE-μCT images (A) and corresponding histological sections (B) of the femoral head cartilage in each group at different time points.