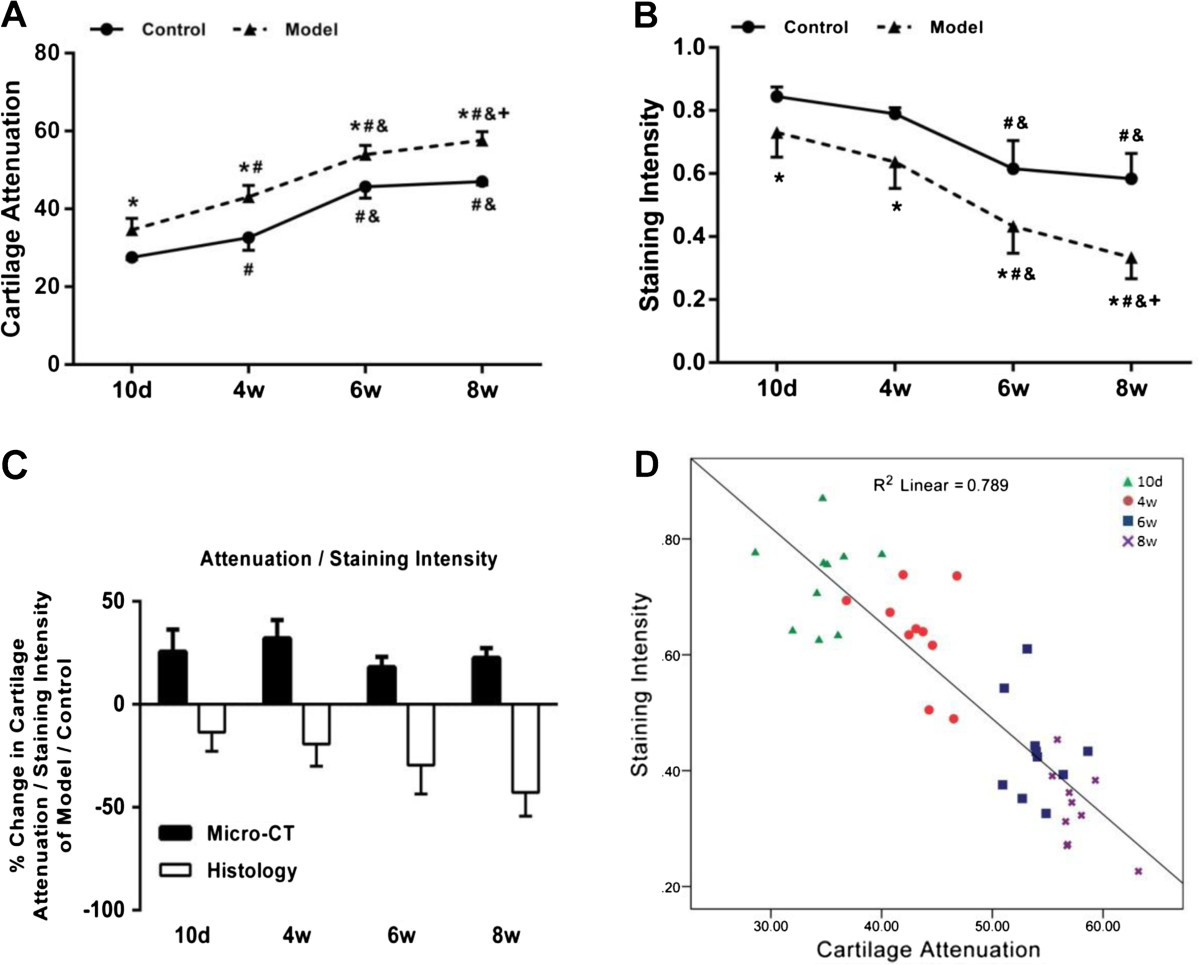
Figure 6.

Quantitative analysis of the changes in cartilage attenuation of CE-μCT images and staining intensity of the safranin-O stained histological sections. (A) Time course changes of the average cartilage attenuation of the femoral head cartilage layer in each group. (B) Time course changes of the average staining intensity of the femoral head cartilage layer in each group. (C) Percentage cartilage attenuation and staining intensity changes of femoral head cartilage layer from the model group over the control group. (D) Linear regression of cartilage attenuation vs staining intensity for femoral head specimens pooled across all the time points in model group. Note: *: P <0.05 vs mice in control group; #: P <0.05 vs mice at post-natal day 10; &: P <0.05 vs mice at post-natal week 4; +: P <0.05 vs mice at post-natal week 6.
