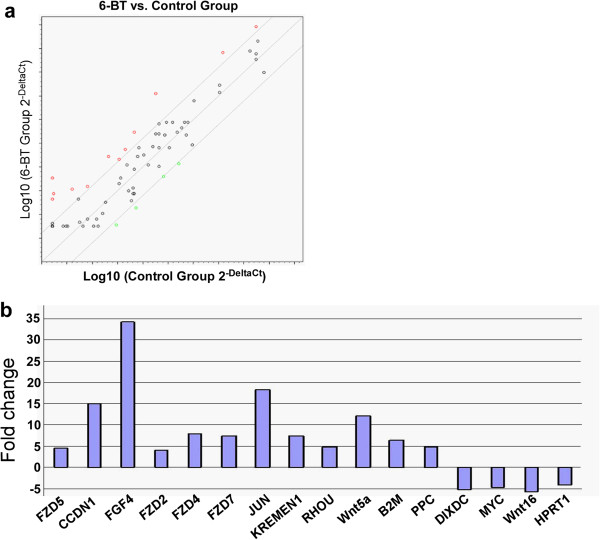
Figure 1.

Wnt signal molecules are regulated upon 6-BT treatment. a. Scatter plot from Wnt signal RT2 Profiler™ PCR array. Red circles represent genes that are up-regulated more than 4-fold upon 6-BT treatment; green circles represent genes that are down-regulated more than 4-fold. b. Genes up- or down-regulated more than 4-fold upon 6-BT treatment.
