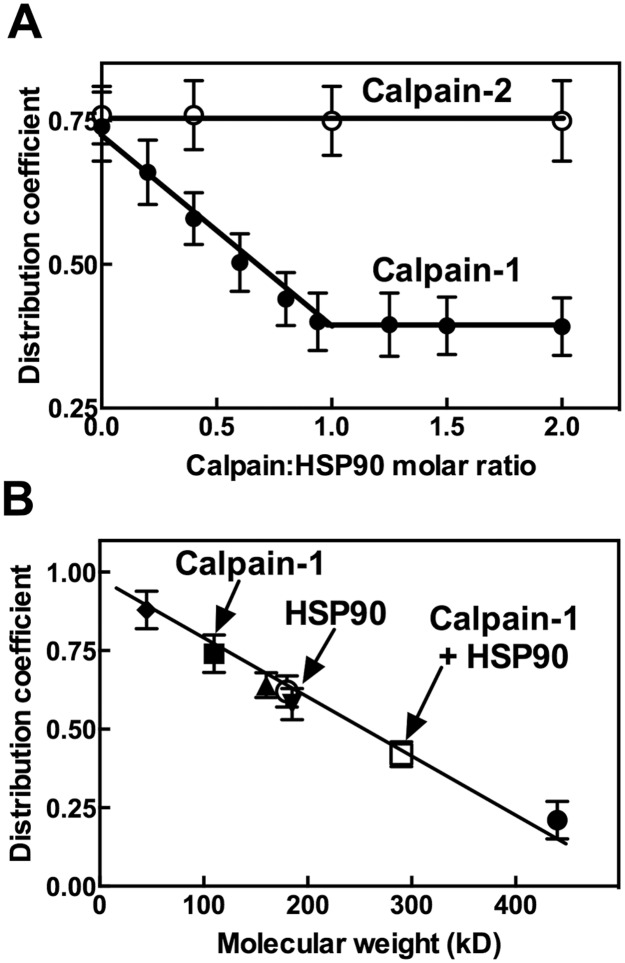
Figure 2. Molecular properties of the HSP90-calpain-1 complex.
(A) HSP90, calpain-1 and calpain-2 were purified as reported in [24, 26, 27]. Calpain-1 or calpain-2 (0.5 μg, corresponding to 4.5 pmoles) were diluted in 0.25 mL of buffer A and added to 0.25 mL of packed Sephacryl S-300 HR (see Methods). HSP90 was also added to the mixtures in amounts (from 0 to 1.65 µg) corresponding to the indicated HSP90:calpains molar ratios. The suspensions were rotated end-over-end for 2 h at 4°C. Resin was then packed and aliquots (0.1 mL) of the clear supernatant were recovered and calpain activity was assayed [26]. Distribution coefficient of calpain was calculated as described in [33–35]. Each point corresponds to the arithmetic mean ± SD of two different experiments. (B) Distribution coefficient-molecular weight calibration curve was determined using the indicated standard proteins: ferritin (●), aldolase (▲), anhydrase carbonic (▼) and ovalbumin (♦). The proteins (10 pmoles) were added to Sephacryl S-300 HR as in (A) and the distribution coefficients were calculated evaluating the protein concentration, with the Bradford method, in the clear supernatants as described in [33–35]. The distribution coefficient of calpain-1 (■) and 1:1 HSP90-calpain-1 complex (□) was evaluated as in (A). The distribution coefficient of HSP90 (○) was determined as indicated for the standard proteins. Each point corresponds to the arithmetic mean ± SD of two different experiments.

