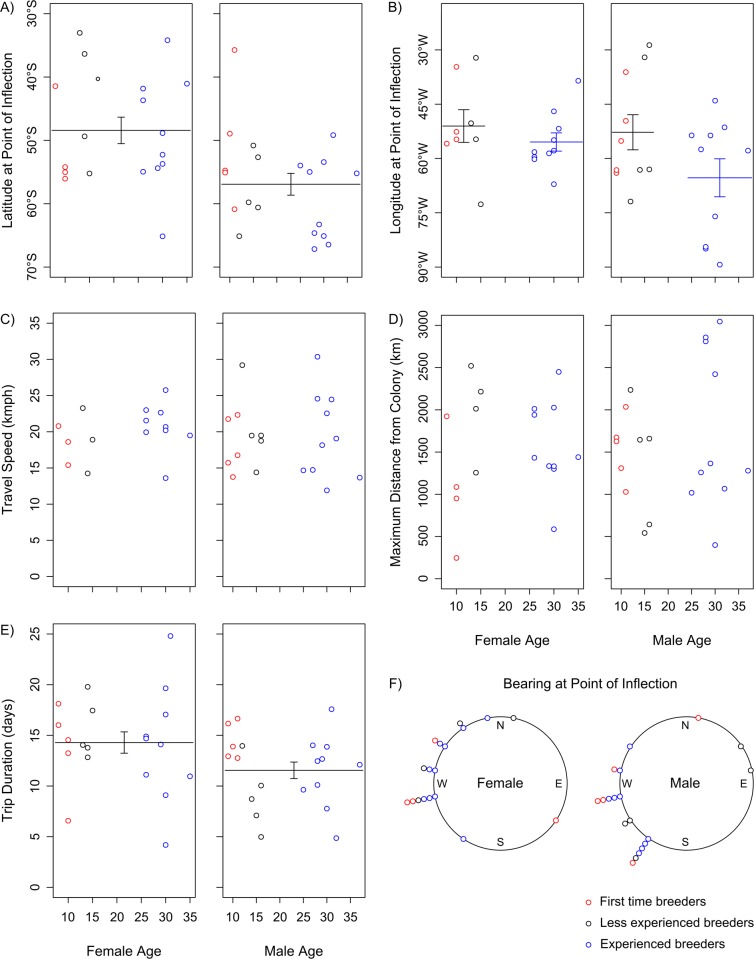
Figure 3. Incubation foraging trip characteristics for birds of different age and breeding experience in 2012.
A) Latitude; B) Longitude; C) Travel speed; D) Maximum distance from colony; E) Trip duration; F) Bearing. Points show raw data, and lines indicate differences in average trait values (± standard error) for either age or breeding experience classes indicated by the best model (although not all are included in the most parsimonious model, see Table 1 and Results).

