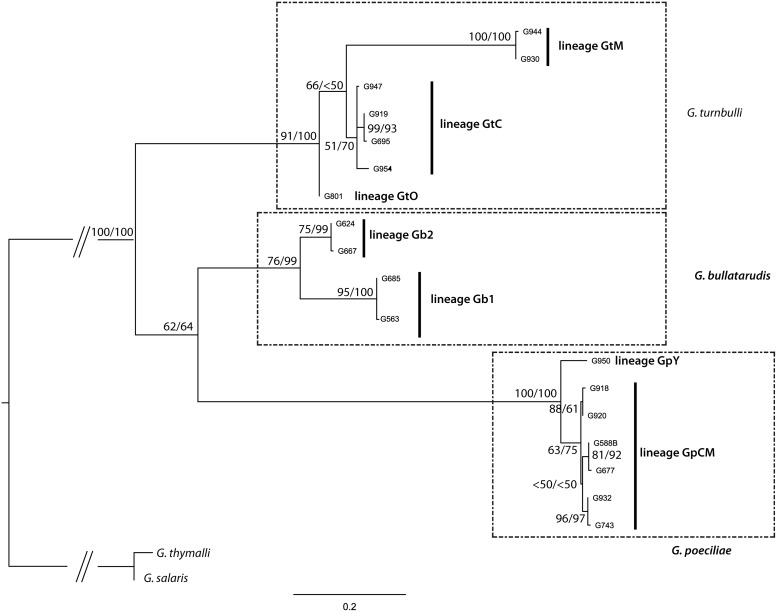
Figure 2. Best Maximum-likelihood tree obtained for the COII of the three Gyrodactylus study species.
Values of nodes correspond to bootstrap support and Bayesian posterior probability, respectively. The three major clades corresponding to Gyrodactylus morphospecies are surrounded by a dotted line. Cryptic lineages within these clades are signaled with black bars.

