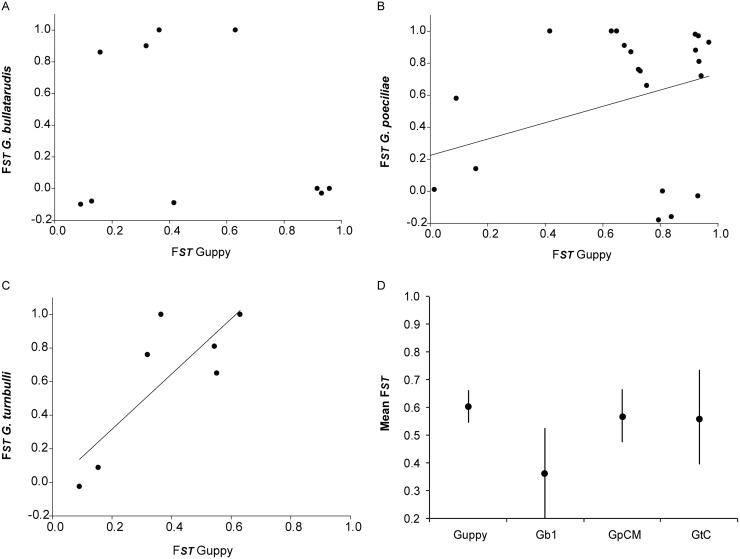
Figure 3. FST plots for guppy host vs parasites of (A) lineage Gb1 of Gyrodactylus bullatarudis, (B) lineage GpCM of G. poeciliae, and (C) lineage GtC of G. turnbulli.
Pearson’s correlation depicted if apparent. Additionally, mean FST and SEM (standard error of the mean) are depicted in (D) for the guppy host and all 3 parasites.

