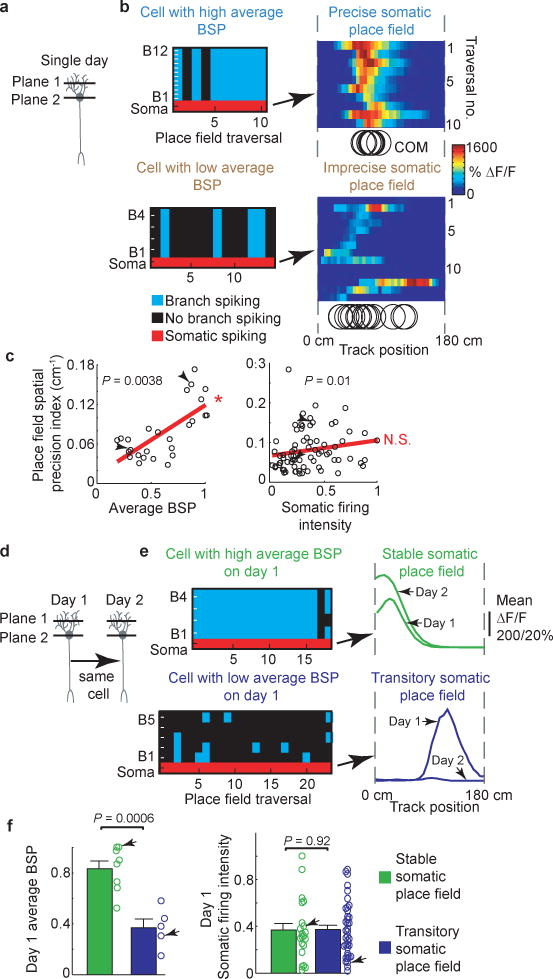
Figure 4. Dendritic branch spike prevalence predicts place field spatial precision and long-term stability.
ai, Schematic of imaging planes. aii, Example cells with high (top left) and low (bottom left) average BSP fields; right, somatic ΔF/F vs. track location raster plots with each traversal’s transient center of mass (COM) (black circles). aiii, left, plot of precision vs average BSP for each place field (n = 26 place fields from n = 8 mice); right, plot of precision vs somatic firing (includes single cell and population imaging experiments; n = 74 place fields from n = 11 mice). Arrows indicate examples from aii. P values from Spearman’s rank correlation test; linear fit shown in red; *significant positive linear slope. bi, Schematic of imaging planes on days 1 and 2. bii, Example cells with high (top left) and low (bottom left) day 1 average BSP; right, associated place fields on days 1 and 2. biii, average BSP (left) and somatic firing intensity (SFI; right, includes single cell and population imaging experiments) for stable (n = 8 place fields from n = 3 mice for average BSP group; n = 21 place fields from n = 6 mice for SFI group) and transitory (n = 5 place fields from n = 2 mice for average BSP group; n = 40 place fields from n = 5 mice for SFI group) place fields; error bars represent SEM; P values from Student’s Unpaired t-test.

