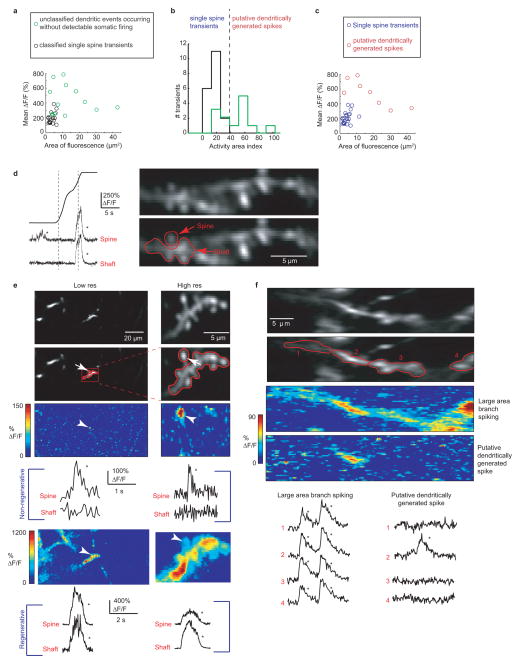
Extended Data Figure 2. Identifying putative dspikes and discriminating between regenerative and non-regenerative dendritic events.
a, Mean ΔF/F of significant calcium transients localized to a single branch (using the same imaging parameters to measure co-occurring somatic firing and branch spikes in Figures 1–4), plotted against the area of significant ΔF/F increase (>3 std). The mean ΔF/F and the area of significant fluorescence change was calculated for each transient as follows. ΔF/F movies were generated where each pixel value in each frame of the movie represents the change in fluorescence with respect to the baseline mean for that pixel. The frames during the transient of interest were averaged together and the number of pixels with ΔF/F >3 were counted, converted to μm2 and used as the area of significant fluorescence change. The mean ΔF/F value for the transient was then calculated as the mean value of the pixels with ΔF/F >3. Black circles represent known single spine calcium transients acquired using low resolution time-series acquisition (the same resolution used to identify branch spiking), but confirmed as spines using higher-resolution time-series acquisitions where calcium transients were restricted to the spine head (see (d,e))). Green circles represent calcium transients restricted to a single dendritic branch and occurring in the absence of a somatic firing. Because no high-resolution time-series were acquired from these structures, it was unknown whether they represent transients restricted to single spines or branch spiking. The panels and analysis presented in b and c indicate that a majority of these events are due to branch spiking and not single spine transients. b, As a combined metric of mean ΔF/F and area of fluorescence change, we normalized mean ΔF/F and area of fluorescence to their maximums and measured the distance from the origin (the normalized Euclidean distance of each point in (a)); we refer to this metric as the Activity Area Index (AAI). Histogram showing known spine transients all fall into the lowest AAI bins (black bars; AAI<40), and most unclassified events (putative dspikes) in (a) have higher AAIs (green bars). The events in the larger AAI bins (with greater mean ΔF/F covering a larger area; AAI>40; separated from the lower AAI bins by the dashed line) fit known characteristics of dspikes. c, Using the AAI threshold defined in b, most of the unclassified transients fall into a separate group (red) from the known single spine calcium transients (8 of the 13 unclassified transients had distinctly larger AAIs compared to spine transients, blue) and were therefore considered branch spikes (putative dspikes). d, Example calcium transients restricted to a single spine head (bottom left) and invading both spine head and shaft (bottom right) in a place cell. Mean somatic place field is indicated by the gray dashed line. e, Example of a stretch of dendrite imaged at low (left) and high (right) resolution in a navigating mouse. The red box and ROIs indicates the same structures that were imaged at both low and high resolution. The same spine head is indicated by arrows at different resolutions in all images. Calcium transients restricted to the same single spine head are shown at both low and high resolution by the color-coded % ΔF/F map and by the % ΔF/F traces in the middle (labeled Non-regenerative); note that the shaft ROI includes other non-active spines. Calcium transients invading the branch and all spines are shown at both low and high resolution by the color-coded % ΔF/F map and by the % ΔF/F traces at the bottom (labeled Regenerative) f, Image of a dendritic branch split into 4 ROIs. Calcium transients are seen in all parts of the branch during large area branch spiking (see both color-coded map and traces of % ΔF/F)). A putative dspike, during navigation, in the same branch causes a significant increase in fluorescence in only part of the branch (ROI 2), which includes the shaft.

