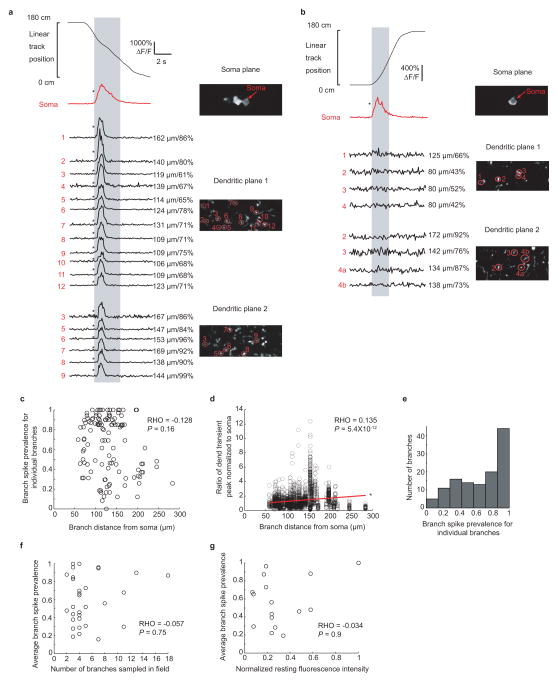
Extended Data Figure 5. Branch spiking in a single dendritic plane is representative of activity throughout a large portion of the dendritic arbor and average branch spike prevalence is independent of the number of sampled branches in the field, their distance from the soma and the resting fluorescence level of the soma.
a, An example of spiking throughout all imaged branches during 3 plane imaging. Co-acquired somatic and dendritic time-series were recorded using three planes; Dendritic plane 1 is approximately mid distance between the soma and dendrite tips, Dendritic plane 2 is near the branch tips. Numbered arrows indicate branches connected to the imaged soma with the same numbers in dendritic plane 1 and 2 indicating the same branch. An example run through the cell’s somatic place field (gray) and corresponding ΔF/F traces from the soma and numbered branches from the two dendritic planes is shown. Distance along dendrite between branch and soma, and % distance from soma to dendritic tip, are on the right of each trace. b, Same as a, except a different cell where branch spiking is absent throughout all imaged branches in both dendritic planes. c, Scatter plot showing the average Branch Spike Prevalence for individual branches during somatic firing as a function of branch distance from the soma (each point represents one branch). The average Branch Spike Prevalence for individual branches is not significantly related to the distance from the soma (Spearman’s rank correlation coefficient: P = 0.16; rho = −0.128). d, Branch spike peaks normalized to co-occurring somatic peaks during place field traversals from all place cells and branches plotted against branch distance from soma. Spearman’s rank correlation coefficient shows a significant correlation (P = 5.4 × 10⁻¹², rho = 0.135) and a linear fit shows a significant positive slope within 95% confidence bounds. e, Histogram showing the branch spike prevalence for individual dendritic branches taken from all cells. f, Average branch spike prevalence (for each place field) plotted against the number of branches sampled in the imaging field shows no significant correlation (Spearman’s rank correlation coefficient: P = 0.75; rho = −0.057). g, Average branch spike prevalence (for each place field) plotted against normalized resting fluorescence intensity of the soma. Relative resting fluorescence between cells was calculated by dividing the mean measured fluorescence of each soma (not during transients; excluding nucleus) by the squared laser power arriving at the soma (which was estimated based on the soma depth below the surface (Gobel, et al., 2007)). Spearman’s rank correlation coefficient shows no significant correlation (P = 0.9; rho = −0.034).

