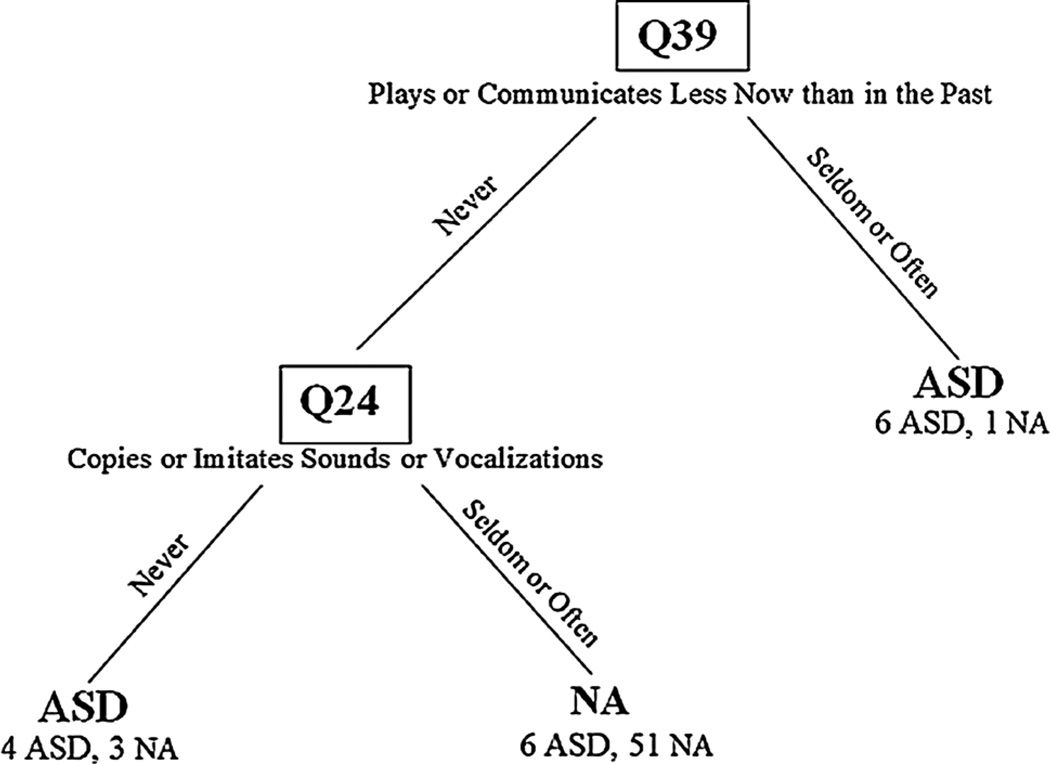
Fig. 1.
Classification tree results. The FYI items used in the model are specified at each branch of the tree, with the values they take for each side of the split. The number of children from each diagnostic group for each leaf is listed below the predicted classification. For example, of the seven children who scored “seldom” or “often” on Q39, 6 are from the ASD group and are classified correctly, and one is from the Non-ASD group and is misclassified. The 64 children who scored “never” on Q39 were further classified based on the results of Q24. Q question, ASD autism spectrum disorder, NA non-ASD

