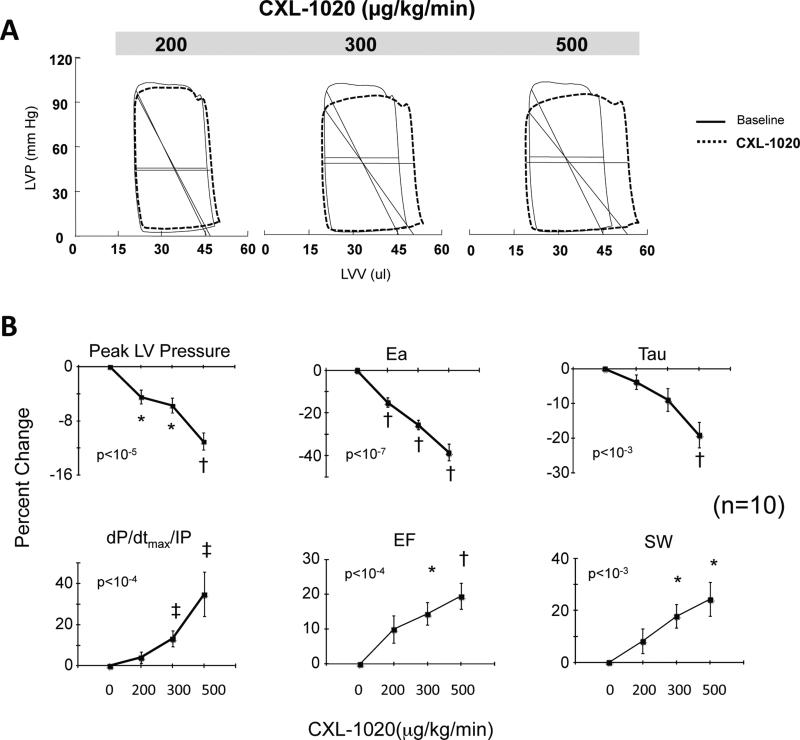
Figure 1.
A) Example of pressure-volume loops in control mice exposed to incremental doses of the pure HNO donor, CXL-1020. There is a gradual decline in ventricular afterload indexed by Ea (diagonal line). B) Summary data (n=10) for dose-dependent changes in ventricular endsystolic pressure (LV-ESP), effective arterial elastance (Ea), LV contractility (dP/dtmax/IP) and relaxation time constant (Tau-l), and integrated function (ejection fraction, EF, and stroke work, SW). Data are shown as percent change from baseline. P-values in figure are for multiple regression analysis of variable vs. dose that also included a dummy variable for each mouse. * p≤0.01, †≤0.001, ‡p≤0.03 vs. baseline (Bonferroni corrected for multiple comparisons).

