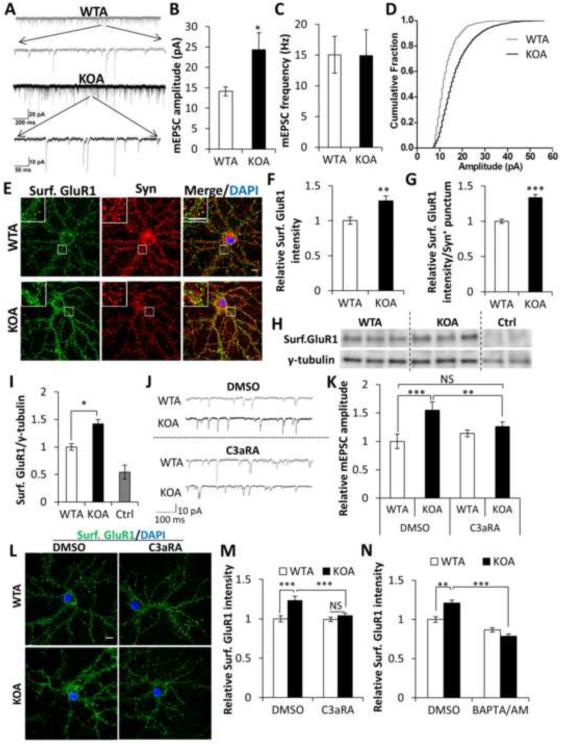
Figure 6. C3aR and intraneuronal calcium mediates excitatory synaptic transmission and surface AMPAR expression.
(A) Example mEPSC traces of wild-type or IκBα KO astroglia (WTA or KOA) co-cultured neurons. (B) Increased mEPSC amplitude in KOA neurons compared to WTA controls. (C) No differences of mEPSC frequency between WTA and KOA cultures. (D) mEPSC amplitude fractionation curve of WTA and KOA neurons. NWTA=13; NKOA=14. (E) Representative images of co-cultured WTA and KOA neurons stained against surface GluR1 (Surf. GluR1) and synaptophysin (Syn) and counter-stained with DAPI. Inset: Enlarged images of the bracketed areas. (F) Relative fluorescence intensity of Surf. GluR1 over whole cell surface (NWTA=20; NKOA=19) and (G) Relative fluorescence intensity of Surf. GluR1 in Syn+ puncta (NWTA=60,000; NKOA=45,000). (H) Blots of surface GluR1 in co-cultured neuronal lysates. Cell surface protein samples were prepared by surface biotinylation. Ctrl lanes are samples from neurons without biotin incubation. Loading was quantified by blotting with an anti-γ-tubulin antibody in cell lysates before neutravidin pulldown. (I) Quantification of the blot in (H). (J) Sample mEPSC traces of wild-type or IκBα KO astroglia (WTA or KOA) co-cultured neurons treated with DMSO or 1 μM C3aRA for 4 days. (K) Mean mEPSC amplitude of treated neurons. NWTA DMSO=8; NKOA DMSO=9; NWTA C3aRA=12; NKOA C3aRA=17. (L) Representative images of surface GluR1 staining with DAPI counter-staining in WTA or KOA neurons treated with DMSO or C3aRA. (M) Quantification of fluorescence intensity of (L). NWTA DMSO=35; NKOA DMSO=31; NWTA C3aRA=33; NKOA C3aRA=37. (N) Quantification of Surf. GluR1 fluorescence in co-cultured neurons treated with DMSO or 1 μM BAPTA/AM for 15 min. NWTA DMSO=29; NKOA DMSO=24; NWTA BAPTA/AM=34; NKOA BAPTA/AM=31. Scale bar: 10 μm. B, C, F, G, and I: Student’s t-test; K, M, and N: Two-way ANOVA followed by pairwise comparison. *P < 0.05; **P < 0.01; ***P < 0.001; NS: non-significant. See also Figure S5.

