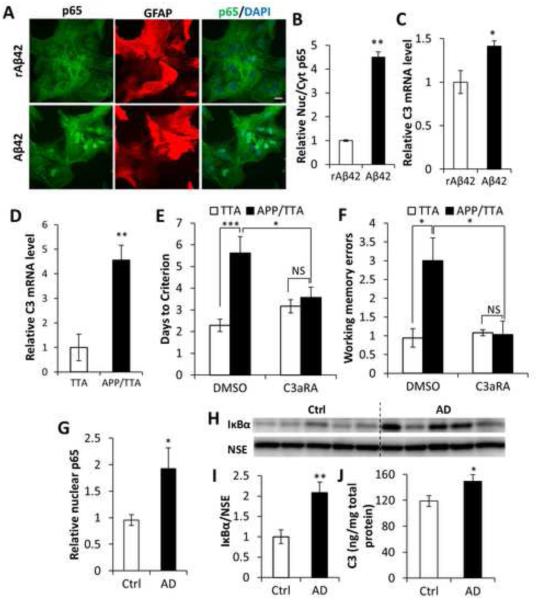
Figure 7. Activation of the NFκB/C3 in AD and beneficial effect of C3aR antagonist.
(A) p65 and GFAP double-staining of primary wild-type astroglial cultures incubated with Aβ42 peptide showing p65 nuclear translation induced by Aβ42. Reverse Aβ42 peptide (rAβ42) was used as a negative control. Scale bar: 20 μm. (B) Quantification of nuclear/cytoplasmic p65 ratio. N=50 cells per group. (C) qPCR measurement of C3 mRNA expression in astroglial cultures treated with Aβ42 or rAβ42. N=3 per group. (D) C3 mRNA expression in the APP/TTA AD mouse model compared to the control TTA mice. NTTA=6; NAPP/TTA=7. (E) Rescue of Morris water maze deficits in APP/TTA mice by C3aRA. NTTA DMSO=7; NAPP/TTA DMSO=8; NTTA C3aRA=6; NAPP/TTA C3aRA=7. (F) Rescue of radial arm water maze deficits in APP/TTA mice by C3aRA. NTTA DMSO=7; NAPP/TTA DMSO=8; NTTA C3aRA=5; NAPP/TTA C3aRA=7. (G) ELISA measurement of NFκB subunit p65 in nuclear fractions of human brain lysates from control subjects (Ctrl) and AD patients. NCtrl=7; NAD=8. (H) Western blotting of IκBα levels in Ctrl and AD human total protein lysates. Neuron specific enolase (NSE) was used as a loading control. (I) Quantification of blots in (H). (J) C3 protein concentration in total protein lysates from control and AD brain samples. NCtrl=7; NAD=8. B, C, D, G, I, and J: Student’s t-test; E and F: Two-way ANOVA followed by pairwise comparison. *P < 0.05; **P < 0.01; ***P < 0.001; NS: non-significant. See also Table S1.

