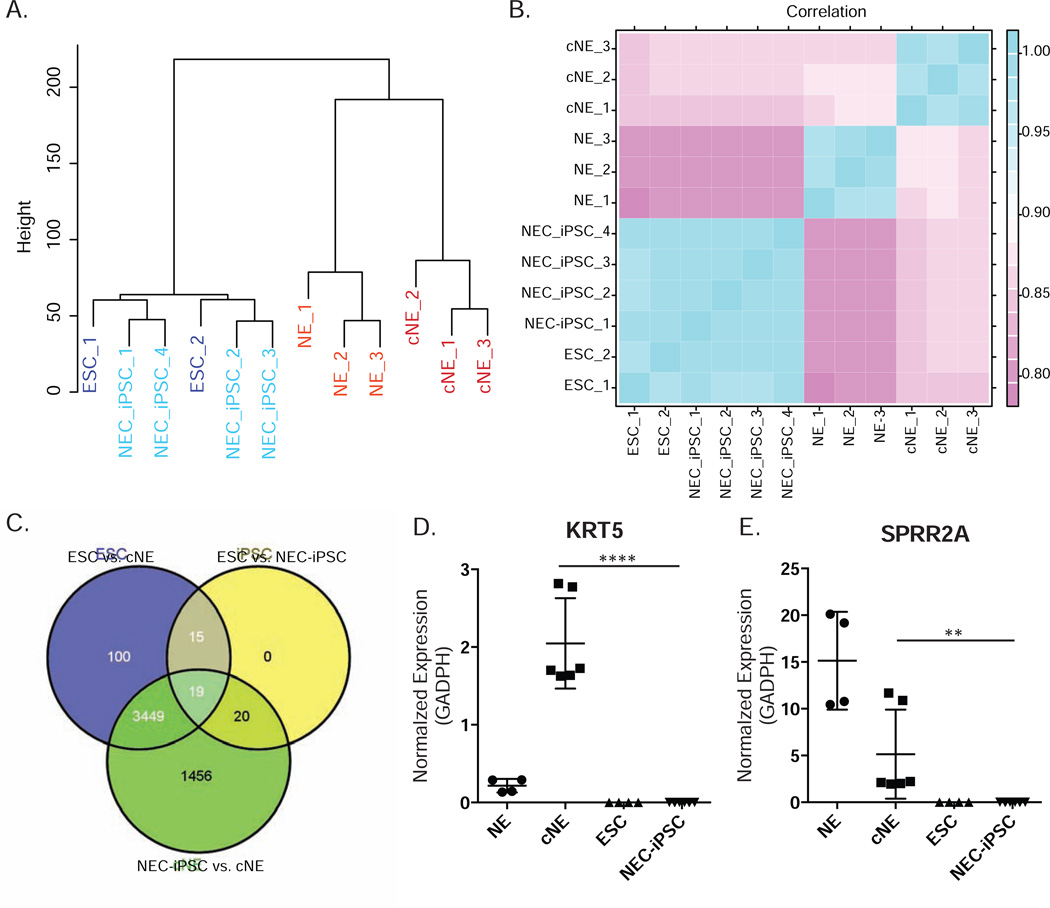
Figure 4. NEC-iPSCs have similar transcriptomes compared to ESCs.
A) Hierarchical clustering of ESCs, NEC-iPSCs, cNEs and NEs. B) Correlation map of samples shown in A. Pearson coefficients between samples were plotted. C) Overlap between the differentially expressed genes from indicated comparisons. D) and E) RT-qPCR of KRT5 and SPRR2A. Data represents mean ± SD of indicated samples. One-way ANOVA, ****p<0.0001, **p<0.01.

