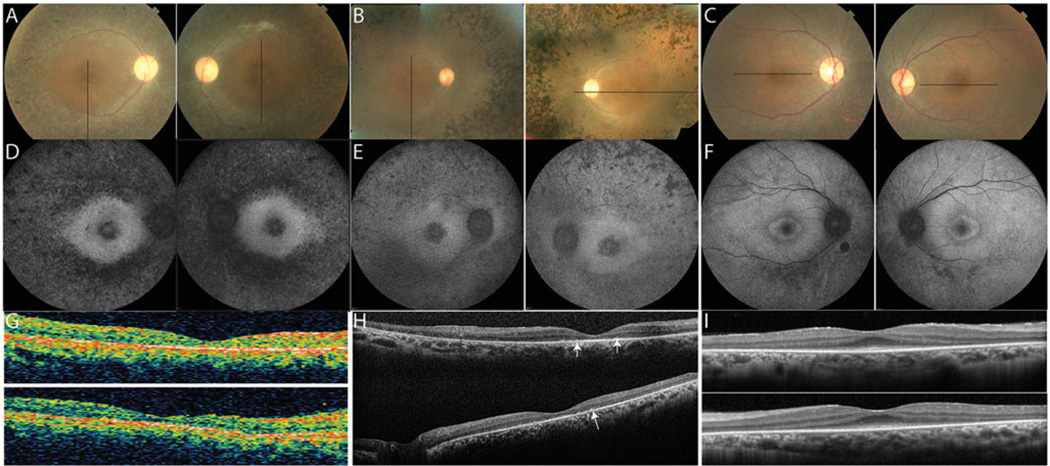
FIGURE 2.
Clinical features at the time of most recent examination in the affected members. (A–C) color fundus photos; (D–F) fundus autofluorescence; (G–I) optical coherence tomography scans of the right (top) and left (bottom) eyes. Black lines on color photos indicate location of OCT scans. Homozygotes show increased autofluorescence around the fovea and severe outer retinal layer loss; spectral-domain OCT shows hyper-reflective profiles in the subretinal space (Figure 2H, white arrows).

