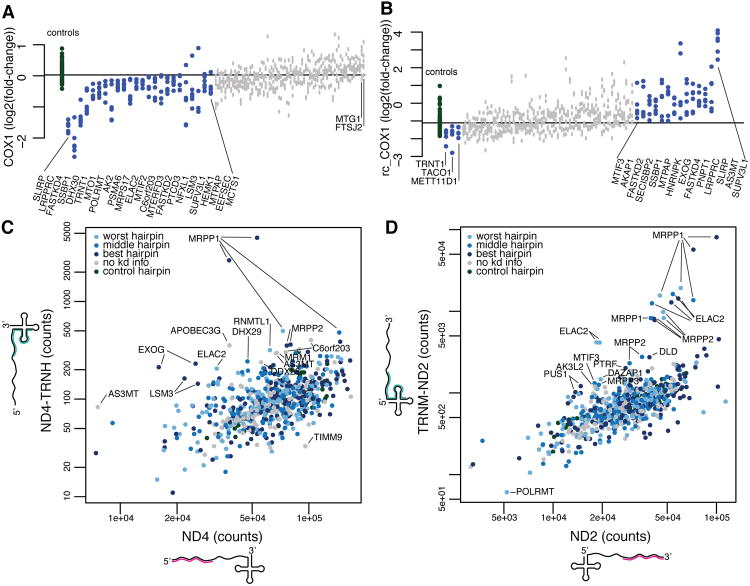
Figure 3. Discordant expression of junction and noncoding probes highlight genes required for processing and degradation.
(A) Expression of the COX1 probe as a log2(expression/shGFP expression) value is plotted for each control (green) and knockdown hairpin (blue denotes nominal p-value <0.01 by Mann-Whitney rank-sum test when comparing six gene-targeted hairpins to the control hairpins shown, grey p-value >0.01). The knockdown of LRPPRC, SLIRP and FASTKD4 caused the strongest depletion of COX1. (B) Expression of the rc_COX1 probe, which targets a noncoding region on the light strand is plotted as in (A). (C) The probe count for each knockdown hairpin was plotted for the ND4 mRNA and ND4_TRNH junction probes. Genes that disproportionally affect one probe are found offset from the diagonal and labeled (Supplemental experimental procedures). Hairpins are colored based on knockdown strength (light blue for worst hairpin, blue for middle hairpin, dark blue for best hairpin, grey for no knockdown information, and green for control). (D) The probe count for each knockdown shRNA hairpin plotted for the ND2 mRNA and TRNM_ND2 junction probe as in (C)(see also Figure S3).

