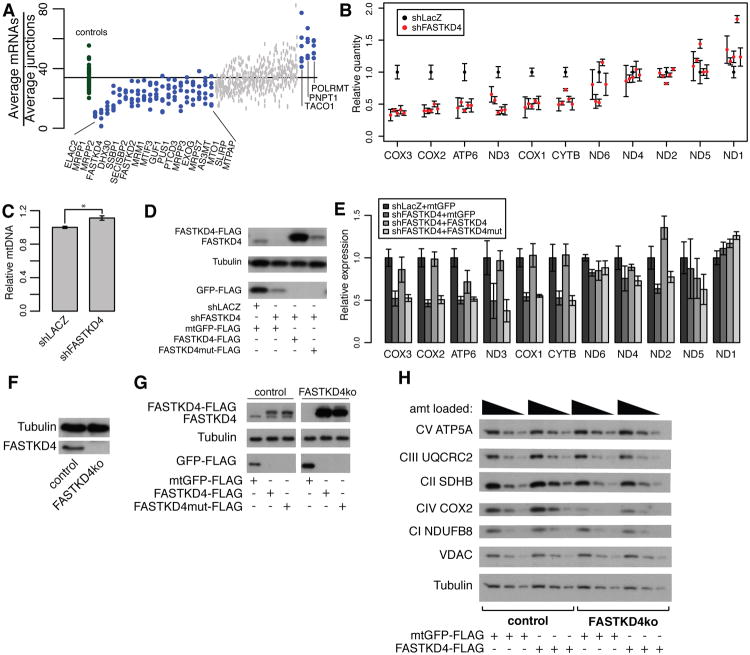
Figure 4. Loss of FASTKD4 leads to loss of a subset of steady-state mtDNA gene products.
(A) The geometric mean of heavy strand mRNA probe counts divided by the geometric mean of heavy strand junction probe counts is plotted for each hairpin. Control hairpins are in green and knockdown hairpins are in blue or grey (blue represents nominal p-value <0.01 by Mann-Whitney rank-sum test). (B) MitoString results normalized to shLacZ for five distinct shFASTKD4 hairpins in HEK-293T cells. Control hairpin shown in black, FASTKD4 hairpins shown in red. (C) Relative mtDNA content in shLACZ knockdown cells compared to shFASTKD4 knockdown cells as measured by qPCR, * indicates p <.05 (two-tailed unpaired t-test). (D) Western blot showing expression of FASTKD4-FLAG and FASTKD4 (detected by FASTKD4 antibody, top), tubulin (loading control, middle), and GFP-FLAG (overexpression control, bottom) in stable HEK-293T cell lines. Cells are overexpressing RNAi resistant FASTKD4-FLAG and FASTKD4mut-FLAG (with RAP domain point mutations), or mitoGFP-FLAG in the presence of shLACZ (control) or shFASTKD4 knockdown, as indicated. (E) Relative expression of each mt-mRNA probe quantified by MitoString, shown for the four cell lines depicted in (D). (F) Western blot showing expression of FASTKD4 and tubulin in the FASTKD4ko CRISPR/Cas9 cell line. (G) Western blot showing expression of FASTKD4-FLAG and FASTKD4 (detected by FASTKD4 antibody, top), tubulin (loading control, middle), and GFP-FLAG (overexpression control, bottom) in control and FASTKD4ko cell lines with overexpression of FASTKD4-FLAG, FASTKD4mut-FLAG, and mtGFP-FLAG as indicated (samples run on same gel with irrelevant lane removed). (H) Western blot showing respiratory complex protein expression in control and FASTKD4ko cell lines with mtGFP-FLAG or FASTKD4-FLAG overexpression as indicated. Three concentrations of each cell lysate was loaded as indicated. In all panels, error bars represent s.e.m., n=3.

