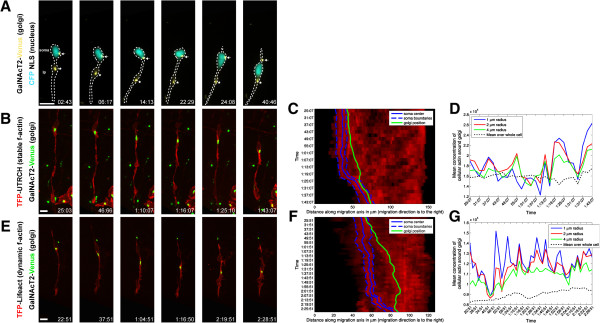
Figure 1.

The Golgi apparatus displays two-stroke motility dynamics. (A) The Golgi apparatus (labeled by GalNAcT2-Venus, yellow) translocates before the nucleus (labeled by cyan fluorescent protein-NLS, teal) moves forward. The soma and leading process are labeled in the first frame and a star indicates the position of a Golgi fragment in the leading process dilation and an arrow indicates a Golgi fragment in the cell body. The Golgi apparatus (green) is embedded within the stable F-actin (labeled by (B) TFP-UTRCH, red, and by (E) TFP-Lifeact, red) contractile domain in the leading process of living neurons. Note that the Golgi enters the leading process when the process’ base dilates. (C, F) Adaptive volumetric kymographs of the sequences shown in Panels B and E (somal boundaries, dashed blue line; soma center, solid blue line; Golgi position, green line; TFP-UTRCH or TFP-Lifeact, red). (D, G) Analysis of mean actin concentration around the Golgi for the sequences shown in Panels B and E, concentrations were computed within a 1, 2, or 4 μm radius from the center of the Golgi (black dashed line represents the average actin concentration throughout the cell). Scale bar, 10 μm.
