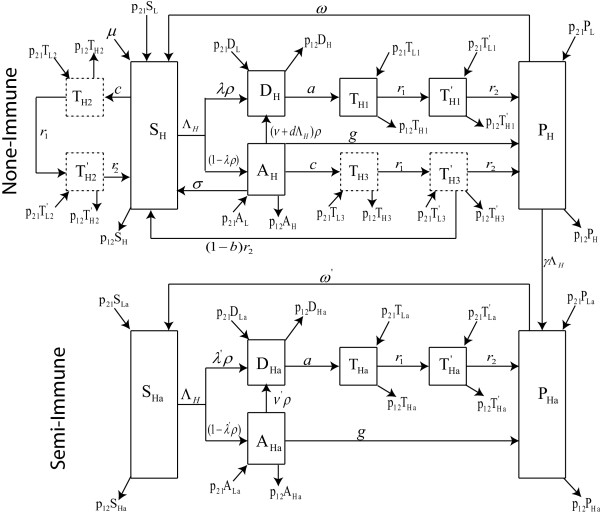
Figure 1.

Model schematic. Schematic diagram of the movement model for the high transmission area showing disease progression in non-immune and semi-immune individuals. The schematic of the movement in the low transmission area is similar to that of the high transmission area ith the following changes: all variables indexed H become variables indexed L and vice versa, while all movements parameters p ij become p ji parameters in the low transmission case.
