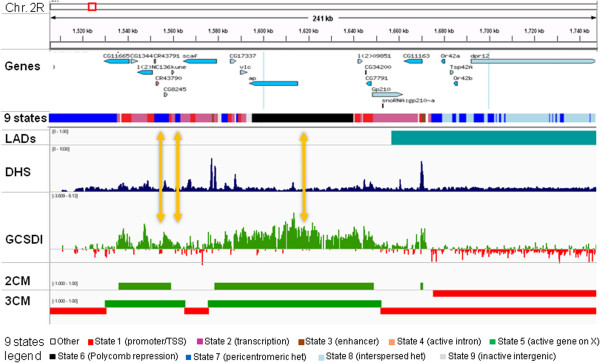
Figure 1.

Genome viewer snapshot shows domains of open and closed chromatin detected by GCSDI. An approximately 250 kbp window demonstrates the relationship of differential GCSDI signal, 2CM, and 3CM models to the genes, predicted 9 chromatin states, and lamina-associated domains (LADs). DNase I hypersensitive site assay signal (DHS) is shown for comparison. Open chromatin domains are shown in green and closed – in red in 2CM and 3CM traces. Discrepancies between chromatin structure predictions (repressed) and chromatin compactness (open) are outlined by arrows.
