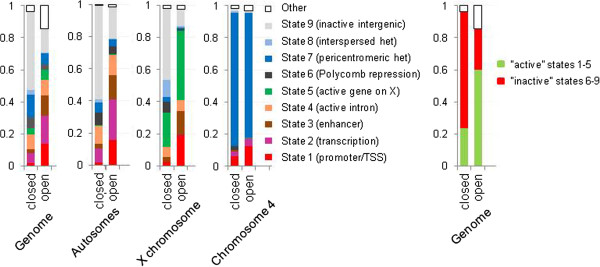
Figure 4.

Contributions of the predicted chromatin states to open and closed chromatin. Results are shown for the whole genome, and separately for major autosomes and chromosomes X and 4 (left panels). In addition, cumulative contribution of the states 1–5 considered “active” chromatin, and of the states 6–9 considered “inactive” or repressed, are shown for open and closed chromatin in the whole genome (right panel).
