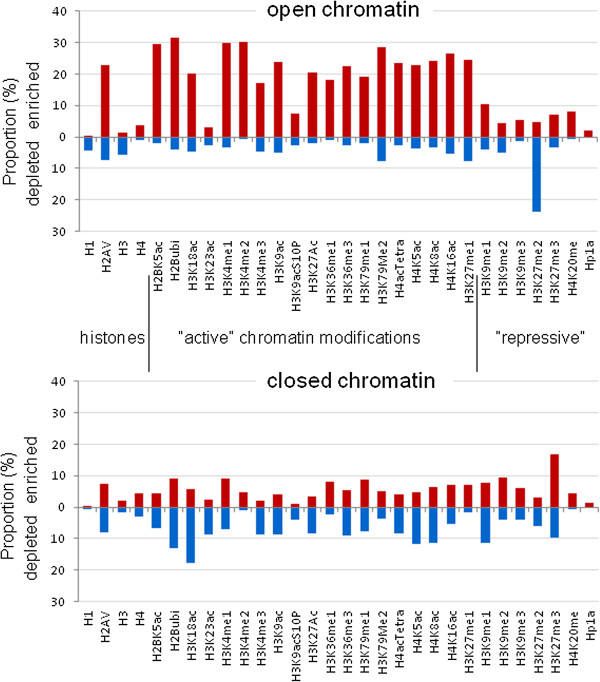
Figure 5.

Enrichment and depletion of chromatin modifications in open and closed chromatin. Bars show percent proportions of regions enriched with (red) or depleted of (blue) particular chromatin modifications in open and closed chromatin domains detected by 3CM. Data are cumulative for the entire genome.
