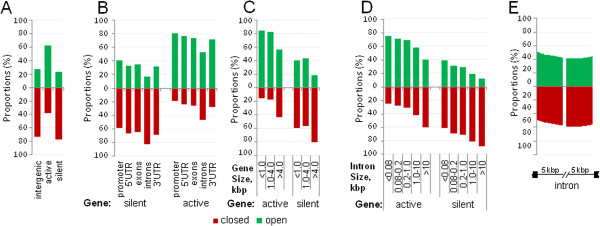
Figure 7.

Relationship between open and closed chromatin and gene structure. Proportions of open and closed chromatin detected by 2CM are shown for intergenic spacers and active or silent genes (A) and for structural elements of active and silent gene (B). Analysis of relationship between chromatin structure and the size of gene (C) and intron (D) shows that proportion of open chromatin diminishes as the gene and intron size increases for both active and silent genes. (E), Distribution of poen and closed chromatin along large (>10 kbp) active gene introns.
