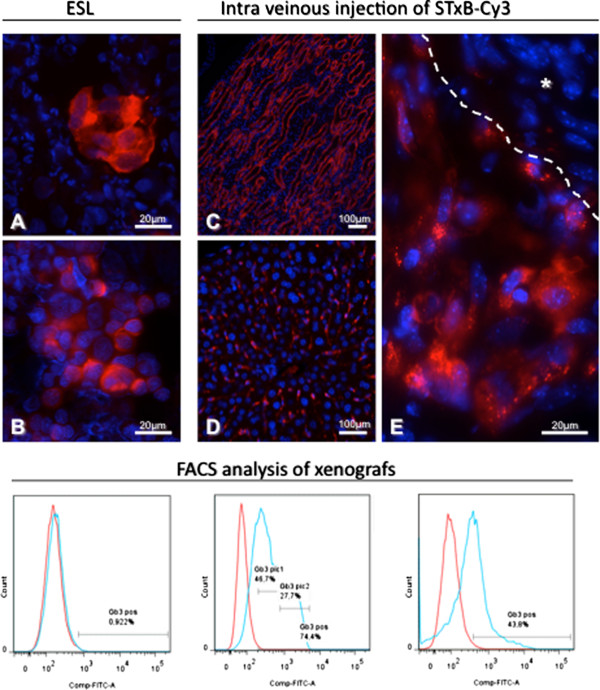
Figure 4.

Gb3 expression in mice with HBCx. Upper part: STxB-Cy3 accumulation in tumor and organs after ESL or intravenous injection. A, B: Gb3 expression in fine-needle aspirates of HBCx with accumulation of STxB-Cy3 in tubular structures (A), or individualized cells (B). C: Diffuse and high expression of Gb3 in tubular structures of renal medulla, D: Diffuse and low expression in liver parenchyma in cells with endothelial morphology lining liver sinusoids, E: Gb3 expression in HBCx. Note a diffuse and high STxB-Cy3 accumulation in tumor cells with epithelial morphology compared to the absence of Gb3 expressing cells in tumor stroma (*). Lower part: FACS analysis of Gb3 expressing tumor cells in different HBCx. Note the lack of Gb3 positivity in HBCx-11 (left), the presence of two populations of Gb3 expressing cells in HBCx-52 (middle), and of one Gb3 positive population in HBCx-162 (right).
