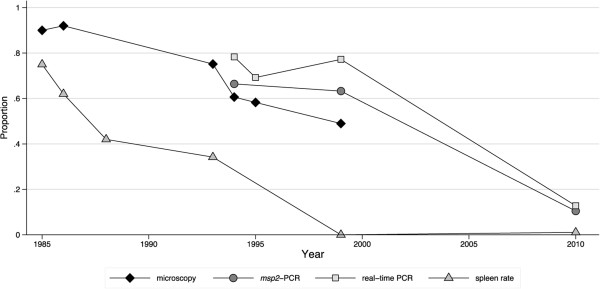
Figure 3.

Parasite prevalence and spleen rates in children aged two to nine years in repeated cross-sectional surveys in 1985–2010. Parasite prevalence was assessed by microscopy, real-time PCR, and msp2-PCR. ITNs were distributed in October 1993-April 1994 (n = 300) and in 1999 after the survey (n = 900); LLINs were distributed after the survey 2010 (n = 1,000) (as indicated by arrows). The data from 1986–1988 are available only as published data, spleen rates are available for individual years, whereas parasite prevalence by microscopy is only available as pooled data.
