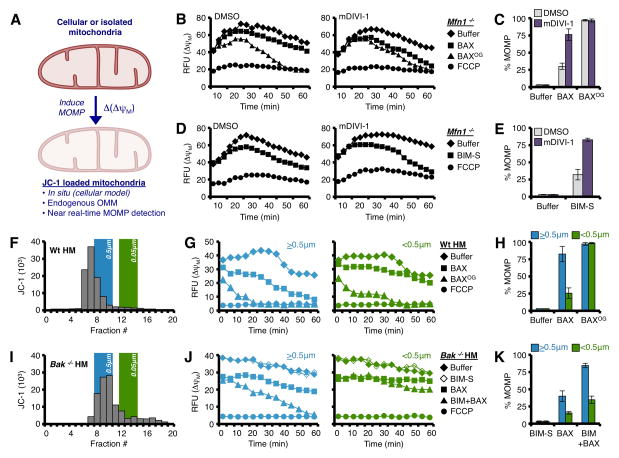
Figure 4. Mitochondrial size dictates sensitivity to BAX-dependent MOMP.
(A) Schematic representation of measuring Δ(ΔψM) to detect MOMP. (B–C) Digitonin-permeabilized, JC-1 loaded Mfn1−/−MEFs (pre-treated with 25 μM mDIVI-1, or DMSO, for 8 h) were incubated with BAX (0.25 μM) or OG-BAX (0.25 μM), and mitochondrial depolarization (ΔψM) was determined. Kinetic and endpoint measurements are shown in B and C, respectively. (D–E) Same as B, but with BIM-S (25 nM). Kinetic and endpoint measurements are shown in D and E, respectively (F) JC-1 loaded Wt liver mitochondria were fractionated by size, and the relationships between 0.5 and 0.05 μm LUVs are indicated on the same graph. (G–H) Larger (>0.5 μm; fractions 6–8) and smaller (<0.5 μm; fractions 11–15) Wt mitochondria were treated with BAX (100 nM) or OG-BAX (100 nM) for 1 h at 37°C. Kinetic and endpoint measurements are shown in G and H, respectively. (I) JC-1 loaded Bak−/− liver mitochondria were fractionated by size. (J–K) Larger (>0.5 μm; fractions 8–10) and smaller (<0.5 μm; fractions 12–16) Bak−/− mitochondria were treated with BAX (20 nM) ± BIM-S (20 nM) for 1 h. Kinetic and endpoint measurements are shown in J and K, respectively. All data are representative of at least triplicate experiments, and reported as ± S.D., as required. See also Figure S5.

