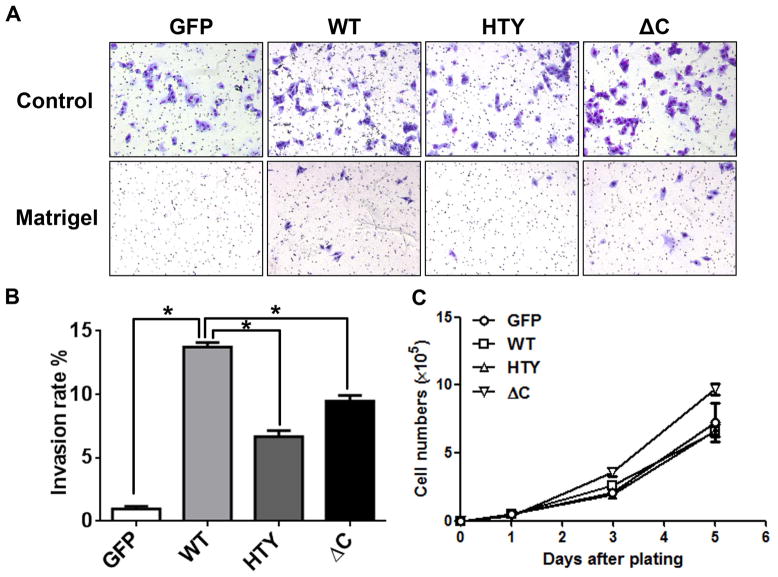
Figure 2.
Runx2 proteins modify phenotypic characteristics of PC3 cells. PC3-L cells expressing GFP, Runx2 WT or Runx2 mutant proteins were subjected to invasion and proliferation assays as described in Materials and Methods. (A) Representative images of invasion assays of GFP, Runx2 WT and Runx2 mutant expressing cell lines (HTY and ΔC) are shown. At least three fields of view from each well were photographed (120x). (B) Quantitation of invasion assays: percent invasion rates of the GFP, Runx2 WT and Runx2 mutant expressing cell lines are plotted relative to the GFP control. Rates were calculated based on the number of cells that migrated through matrigel and membrane vs. those which migrated through membrane alone (control) (n=3 per group). Student’s t-test was used to calculate significance by comparing the values of the WT group with the other three groups. *p<0.001. (C) Growth curves of the indicated cell lines. Values are mean ± SEM of n=3 experiments analyzed in duplicate. Statistical analysis (Student’s t-test) was done by comparing values of the GFP group with the other three groups. *p<0.05.

