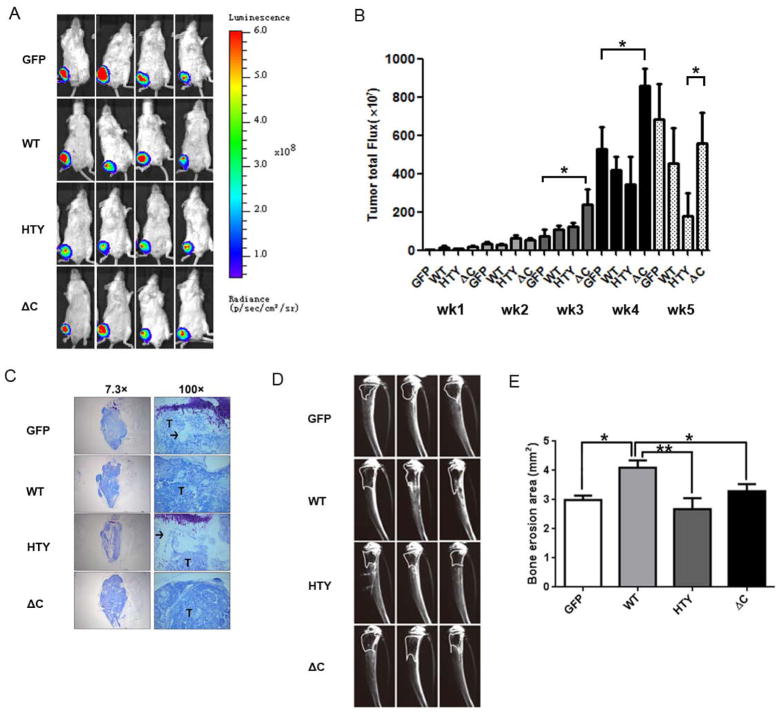
Figure 3.
Intratibial tumor size and associated bone erosion vary according to expression of Runx2 WT or mutants in a xenograft model. (A) In vivo imaging of primary tumors. Ventral images of four representative mice (4 of n=6 total) from each group at five weeks post injection are shown. Bioluminescence from the tumors was captured using an IVIS Imaging System. (B) Quantification of primary tumor luminescence intensity (corresponding to panel A). Images were taken at five time points post-intratibial injection as shown. Values are mean ± S.E.M. for n=6 mice. Statistical analysis (Student’s t-test) was done by comparing values of the groups. *p<0.05. (C) Representative images of Toluidine blue staining of the intratibial tumors at sacrifice (5 weeks) to show tumor size and extensive loss of trabecular bone in metaphysis and growth plate in epiphysis in WT and ΔC group. (D) Representative (3 of n=6 total) radiographs of tumor-bearing tibias 2 weeks after injection with GFP, Runx2 or mutant expressing cell lines. Osteolytic lesions are dark areas outlined with white lines representing loss of trabecular bone. (E) Quantification of osteolytic lesions (n=6 mice). Bone erosion areas (as shown in panel D) were quantified by ImageJ. Statistical analysis (Student’s t-test) was done by comparing values of the WT group with the other three groups.*p<0.05, **p<0.01. Arrow, trabecular bone (white areas); T, tumor.

