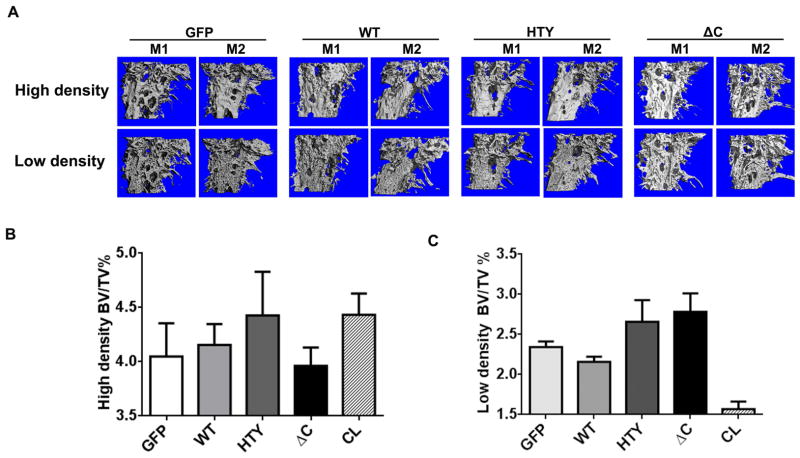
Figure 5.
Overexpression of Runx2 and Runx2 mutant proteins modify bone mass in tumor bearing tibias. (A) Two representative micro-CT images of high bone density in tumor-bearing tibias are shown for each group (GFP, WT, HTY and ΔC) at five weeks post-injection by micro-CT. Osteolytic areas are indicated by empty regions in solid bone; mostly mature woven bone is visualized as fine bony projections from the cortical bone. M=mouse. (B), (C) Quantitative micro-CT analysis of high density bone volume fraction (B) and low density bone volume fraction (C) of tumor-bearing tibias. Total volume (TV) is the same in each group. *ANOVA analysis was performed by comparing the values of all the groups. p=0.05. *The contralateral limb CCL is shown for reference to normal bone

