
Figure 1.
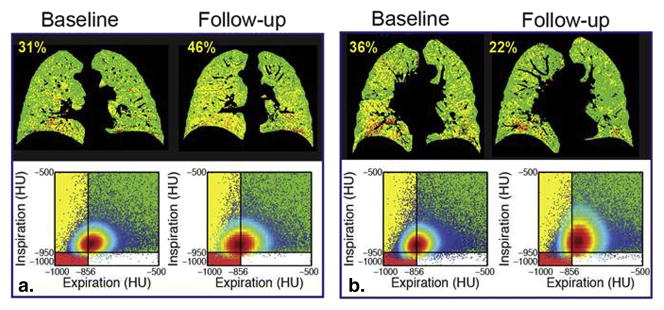
Temporal changes in fSAD as determined by PRM. Representative coronal PRM slice (top) with corresponding Cartesian plot of voxels with paired HU values (bottom) at baseline and 1-year follow-up from cases with (A) increasing and (B) decreasing PRMfSAD. These cases are indicated by (A) * and (B) † in Figure 2. PRMfSAD values are provided in yellow text top-left of PRM image.