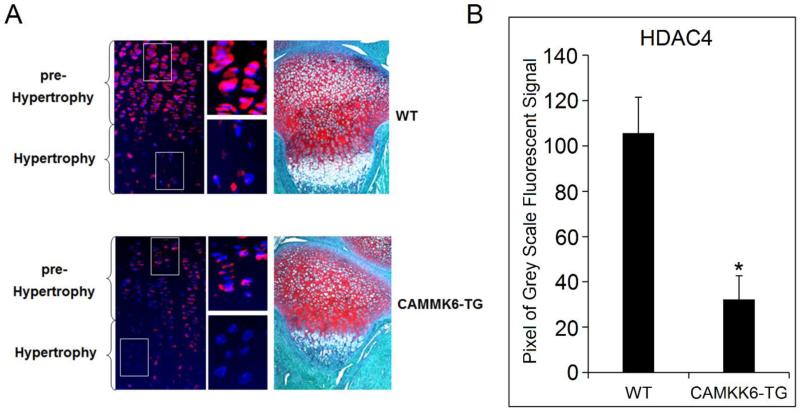
Figure 3. The expression of HDAC4 is dramatically decreased in the growth plate of CAMKK6 mice.
(A) Immunofluorescent histochemistry shows that in WT mice, HDAC4 is highly expressed in the pre-hypertrophic zone (red), but the expression is reduced in the hypertrophic zone. In contrast, CAMKK6 homozygote mice (CAMKK6-TG) exhibit a weaker HDAC4 staining in the pre-hypertrophic zone in comparison to the strong signal in WT mice. Magnified view of the pre-hypertrophic and hypertrophic chondrocytes from WT and CAMKK6-TG mice correspond to the boxed areas. Blue: Nucleus stained by DAPI. Red: HDAC4 stained by Rhoda mine. Purple: overlap of blue and red. Multiple animals were examined and consistent results were obtained (N=4). Safranin-O staining was used to show PG staining on the growth plate. (B) Intensity of the HDAC4 signal was quantified. CAMKK6-TG mice had much lower signal than WT controls. * p<0.05.

