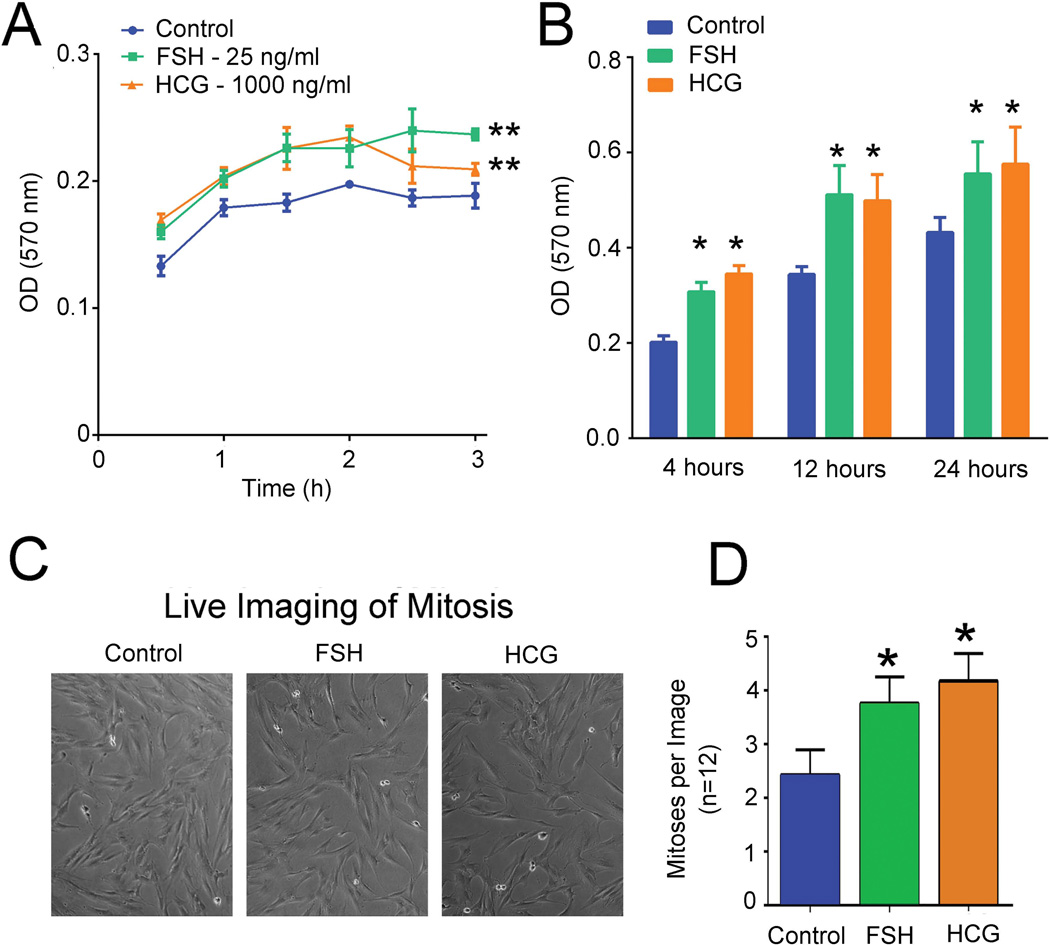
Figure 2. Effects of FSH (25 ng/ml) and hCG (1000 ng/ml) on human MSCs adhesion and proliferation.
(A). Adhesion of MSCs in MTT assays at 30 min - 3h. At each time point, mean ± SD is shown, n = 4; ** indicates p < 0.01. (B). Effects on proliferation. After plating MSCs for 4, 12, or 24 h cell proliferation was measured using MTT. Mean ± SD, n = 4; ** indicates p < 0.01. (C). Live images of control and treated MSCs at 24 h time point. (D). Mitotic events in MSCs treated with FSH and hCG. Events were counted from phase images by observers blinded to conditions studied. Mean ±SD, n = 12; * p < 0.05 relative to the control.

