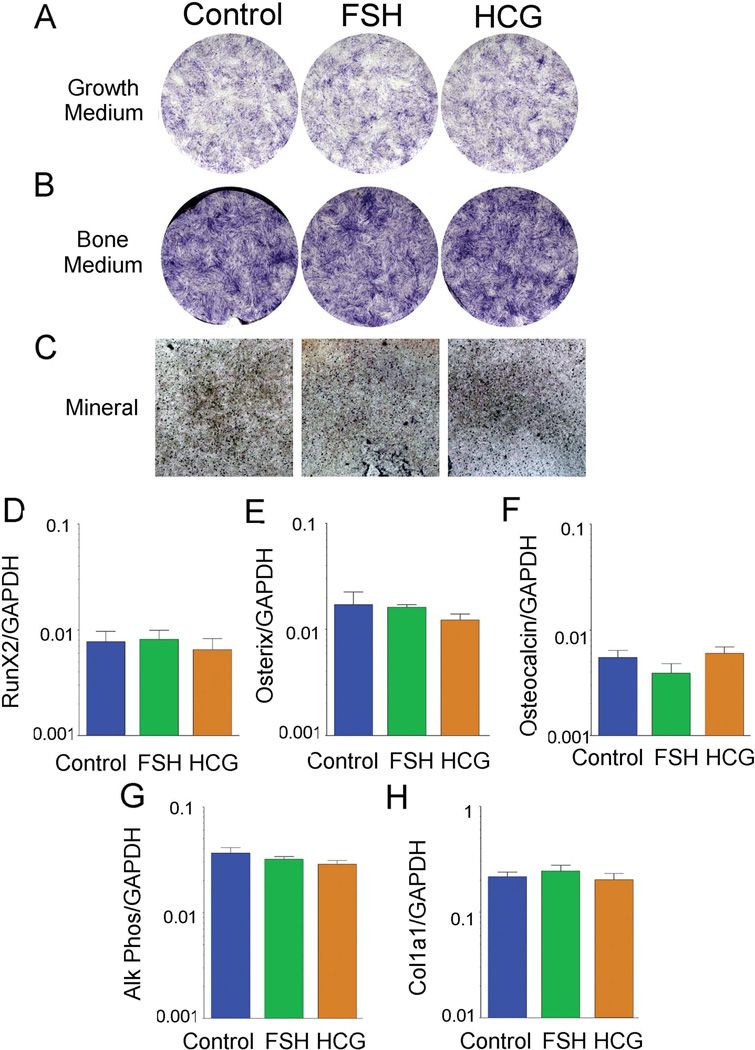
Figure 4. Osteoblast differentiation with and without FSH or hCG.
(A–B). Alkaline phosphatase activity in MSCs cultured in bone differentiation medium, B, relative to growth medium, A. (C). Mineral deposition (black) demonstrated by optical density in transmitted light. One of two duplicate cultures with similar results is shown. Fields are 0.5 cm across. (D–H). QPCR analysis for osteoblast specific gene expression in MSCs treated with FSH or hCG. All assays were normalized to GAPDH. One of three experiments with similar findings is shown.

