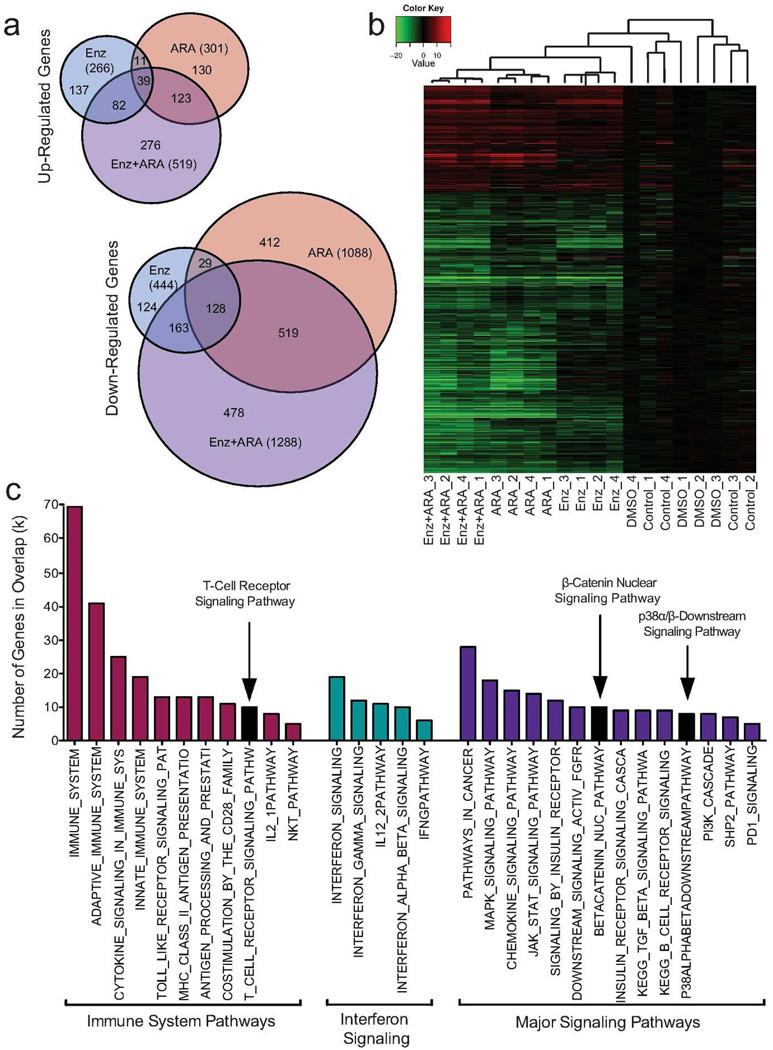
Figure 1. Combined small-molecule microarray analysis and results.
Global gene expression analysis was performed on Hut78 cells treated for 3 days with Enz, ARA, and Enz+ARA. DMSO (vehicle) or no treatment cells served as controls. Four serial replicates were collected. (a) Venn diagrams of up- and down-regulated genes. (b) Hierarchical clustering of the 2,610 differentially regulated genes using Pearson’s Correlation Coefficient. (c) Combined Enz+ARA treatment enriches for an immune cell signature. GSEA was performed on combination-treatment gene signature (1807 total). TCR signaling, downstream p38α/β signaling, and nuclear β-catenin signaling pathways were enriched post Enz+ARA treatment.

