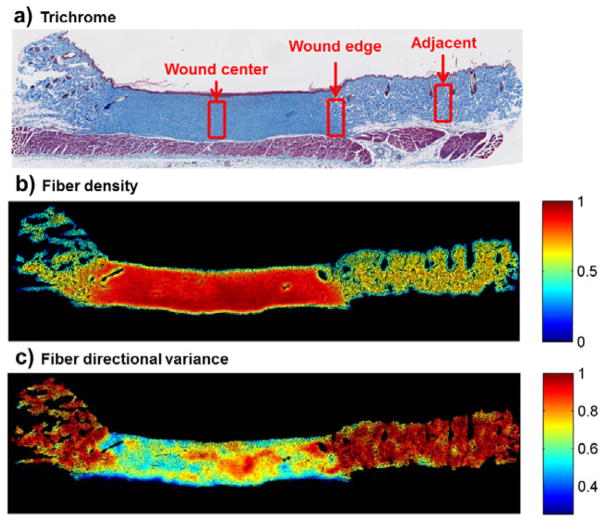
Figure 1. Fiber density and directional variance from a representative sample 6 months after burn injury.
(a) Wound regions were manually selected within a 0.3 × 0.7 mm window delineating the wound center, wound edge, and an adjacent uninjured region. (b) Automated colorimetric analysis of each pixel enabled the identification of collagen-containing pixels, and collagen fiber density (processing step vii in Figure S1) measurements were significantly higher within the scar. (c) Pixel-wise fiber directional analysis enabled quantification of the local strength of collagen fiber alignment, and fiber directional variance (step xi in Figure S1) was significantly lower within the scar.

