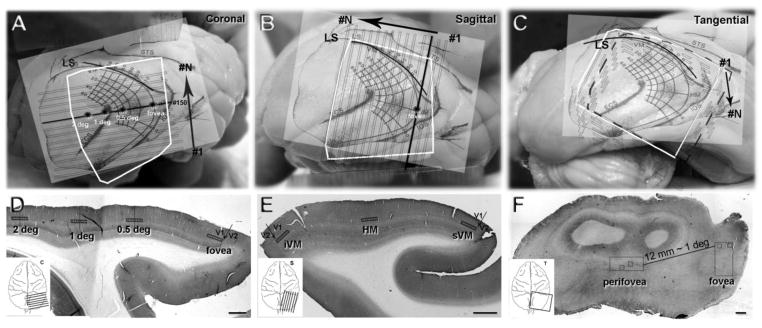
Fig. 2.

Eccentricity of foveal and perifoveal regions of cortex were estimated by the visual field map transformed by Dow et al. 1985. The map is shown schematically projected onto the cortex. A: the orientation of the coronal sections to the map placed on the V1 surface. The orientation of sequential sections is shown by the solid black horizontal line marked at the right-hand end labeled #150 running approximately mediolateral. The different eccentricities are marked with asterisks. The cutting sequence is depicted by the black arrow, the sequence was from posterior (#1) to anterior (#N) cutting direction. B: the orientation of the sagittal sections is shown, the solid black line running posterior to anterior shows the plane of the sections. The cutting sequence shown by the black arrow was from lateral (#1) to medial (#N). C: sections were cut tangential to the pial surface of the most lateral part of V1; in this series the sequence is indicated by the black arrow, starting with most dorsal sections (#1) and moving deeper into the cortex (#N). D–F, single sections in the coronal, sagittal and tangential planes that were immunoreacted for VGlut2. The V1/V2 border can be seen in the D and E as the abrupt transition between VGlut2-ir in layer 4C, and is marked by an arrow. The quantification of VGlut2-ir puncta was obtained from the sampling regions shown by the small boxes in the rectangles (D,E) along the length of layer 4A. In F, the sampling regions are shown as small squares within the two larger foveal and perifoveal areas (rectangles). White squares (A–C) represent the actual shape of the blocks. Scale bars (D–F) 1 mm.
