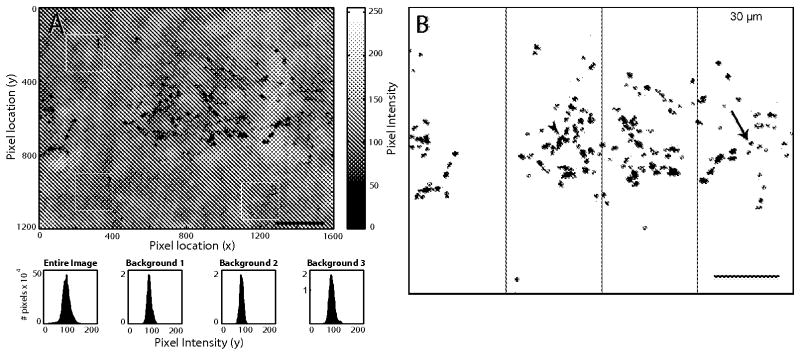
Fig. 3.

Quantification of VGlut2-ir Puncta in Layer 4A. A: High resolution micrograph of layer 4A stained with VGlut2. The background in each image was measured using a MatLab image processing script. B: In each image the intensity was thresholded to give an image of the puncta. In the each thresholded image, four non-overlapping segments that extended 30 μm in the horizontal plane (parallel to the layers) and the whole vertical extent of 4A were drawn in the images. ImageJ was used to quantify the number of VGlut2-ir puncta in each counting frame; only particles larger than 15 pix2 were included in the quantification (particles outlined with red). Scale bars: 20 μm
