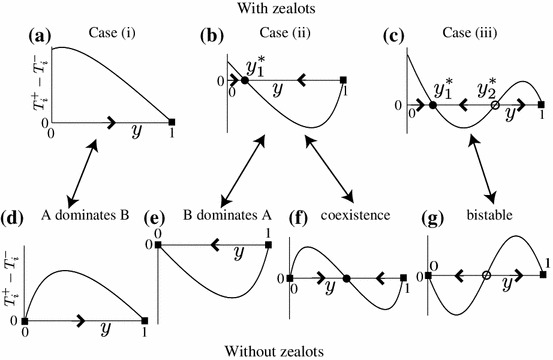
Fig. 1.

Schematic classification of the deterministic dynamics driven by . a–c Populations with zealots. d–g Populations without zealots. Filled and open circles represent stable and unstable equilibria, respectively. Filled squares represent the absorbing boundary condition. It should be noted that we identify
