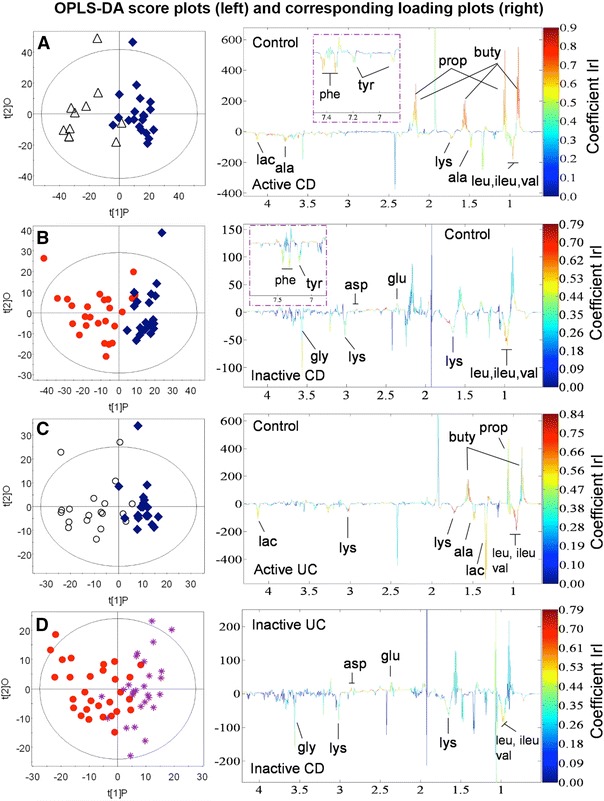
Fig. 1.

OPLS-DA score plots. The score plots (a, b, c, and d) are based on the four valid models containing all patients and display the 1st PLS component and one orthogonal component for each model. A two-way separation of the fecal samples is demonstrated in all 4 plots. Blue diamonds control; empty triangles active CD; red dots inactive CD; empty circles active UC; purple stars: inactive UC. The corresponding back-scaled loading plots reflect the class differences in the NMR spectra. Upright peaks indicate a relatively increased intensity of metabolites, and downright peaks a decreased intensity of metabolites. The colors shown on the plot are associated with the significance of metabolites in separating the samples as shown on the right hand side of the plot, where the color-scaling map is given together with the respective correlation coefficients. In accordance with the sample number in each group and a significance level of p < 0.05, the metabolites are significant at correlation coefficient values above a 0.55, b 0.43, c 0.44, and d 0.38, respectively. CD Crohn’s disease; UC ulcerative colitis; ala alanine; asp aspartate; buty butyrate; glu glutamate; gly glycine; ileu isoleucine; lac lactate; leu leucine; lys lysine; phe phenylalanine; prop proprionate; tyr tyrosine; val valine (Color figure online)
