Figure 3.

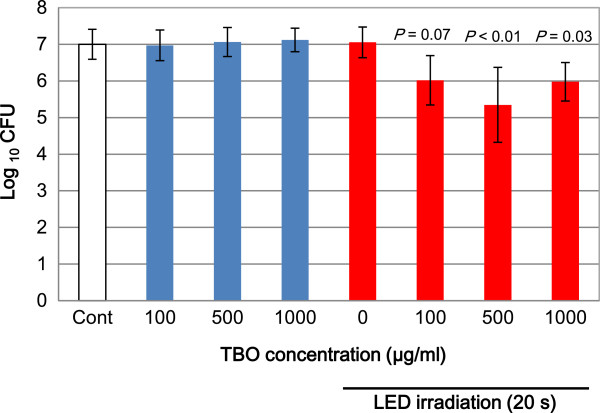
In vitro bacterial reduction effects of aPDT with TBO and LED on S. oralis . Blue bars show the effect of TBO only, and red bars present the effect of TBO with LED irradiation. The data represent mean ± SD (n = 5).

In vitro bacterial reduction effects of aPDT with TBO and LED on S. oralis . Blue bars show the effect of TBO only, and red bars present the effect of TBO with LED irradiation. The data represent mean ± SD (n = 5).