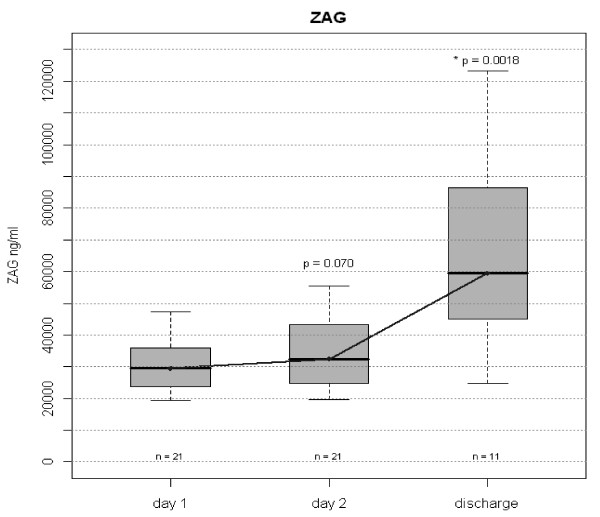
Figure 4.

Plasma ZAG in all patients on day 1, 2 and discharge. ZAG serum concentrations as measured by ELISA. Figure shows median and interquartile range (grey box). Wilcoxon test for paired data was used. Comparisons were made between Day 1 and Day 2 and between Day 2 and Day of Discharge. P values before Bonferroni correction are given in the graph. Corrected p value for Day 2 versus Day of Discharge is 0.0036.
