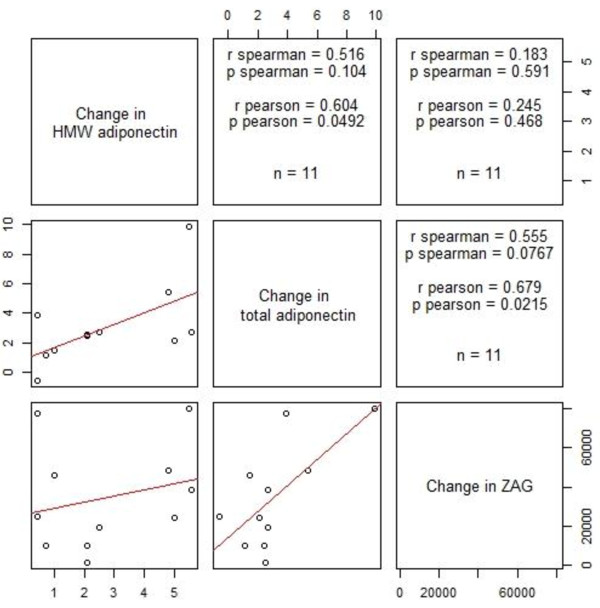
Figure 5.

Correlation between change of HMW adiponectin, total adiponectin and ZAG. Cutting point between imaginary vertical and horizontal lines show Correlation between change of HMW adiponectin, total adiponectin and ZAG in graphic form on the left and Spearman’s and Pearson’s correlation coefficient on the right cutting point.
