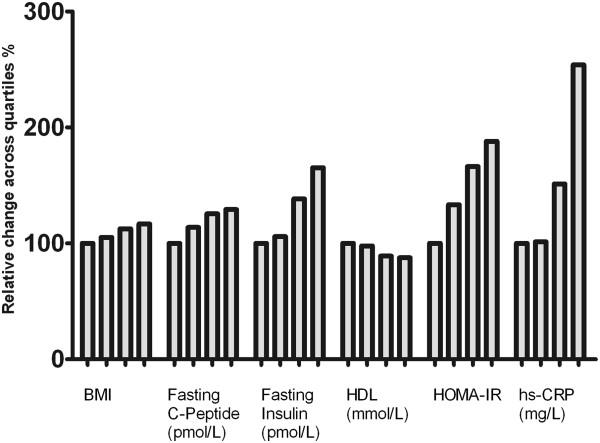
Figure 1.

Relative increase/decrease of BMI, fasting C-peptide, fasting insulin, HDL cholesterol, HOMA-IR and hs-CRP across calprotectin quartiles. The difference across quartiles were significant at the p < 0.0001 (ANOVA) level for BMI and hs-CRP and at the p < 0.05 level (ANOVA) for fasting C-peptide, fasting insulin, HDL and HOMA-IR (ANOVA).
