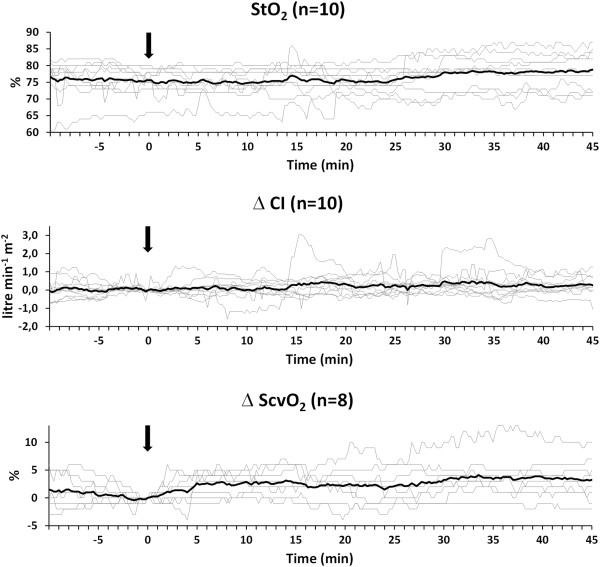
Figure 3.

Evolution of the individual patient values (thin lines) and the average values (thick line) of the tissue oxygenation (StO 2 ) and the relative change of both cardiac index (CI), delta CI, and central venous oxygen saturation (ScvO 2 ), delta ScvO 2 (data of two patients missing/inadequate due to technical problems). All graphs are synchronized at the moment of the first dobutamine administration (Time = 0; arrow). Values are shown from 10 minutes before dobutamine administration until 45 minutes thereafter.
