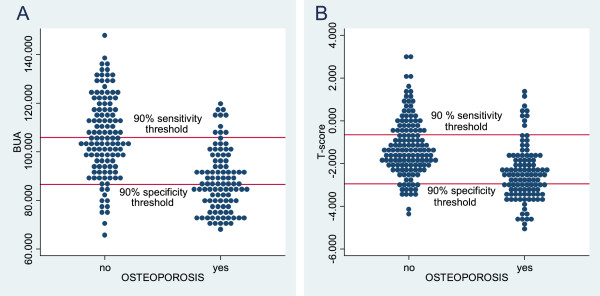
Figure 2.

The distribution of the results of calcaneal QUS (A) and phalangeal RA (B). Plots showing the distribution of the results of QUS of the calcaneus (A) and phalangeal RA (B). Horizontal lines represent the upper and lower triage thresholds at a 90% certainty level. A: 90% sensitivity threshold: BUA=105.88, 90% specificity threshold: BUA=86.63. B: 90% sensitivity threshold: T-score= -0.65, 90% specificity threshold T-score=-2.95. Abbreviations: QUS = Quantitative Ultrasound, RA = Radiographic Absorptiometry, BUA = Broadband Ultrasound Attenuation.
