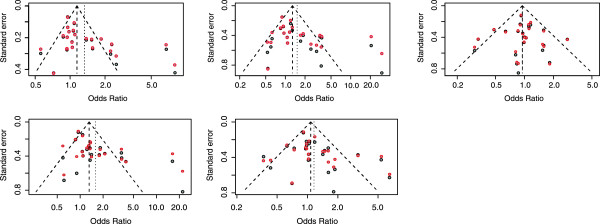
Figure 3.

Funnel plots of a real world example. Funnel plots of the real HuGE review example under different genetic models. Black circles. Standard error estimated from asymptotic variance as the studies’ precision; Red circles. Standard error estimated from smoothed variance as the studies’ precision.
